Information+
Conference 2023
Interdisciplinary practices in information design & visualization
22nd – 24th November
2023
Edinburgh, UK
#infoplus2023
We visualize you inside the info+ community:
Information+ is an interdisciplinary conference that brings together
Information+ is committed to enabling a diverse, inclusive and respectful environment where all participants can learn, network, and enjoy planned activities. We are dedicated to a harassment-free experience for everyone.
Information+ will be held in-person between November 22nd – 24th, 2023 at the University of Edinburgh, at minimal cost to attendees. Building on the experiences from the previous installments of Information+ 2016 at Emily Carr University of Art + Design, Vancouver, Information+ 2018 at University of Applied Sciences Potsdam, and a virtual Information+ 2021, we seek to significantly broaden the base of our interdisciplinary community. Again an in-person event, we want to emphasize exchange and community building.
The conference invites three types of contributions: Presentations, Workshops & Activities, and Exhibition Pieces. We invite proposals from all relevant fields and areas of professional practice, research, and pedagogy. We seek submissions of critical thoughts, theories, practices, and experiences around information design and data visualization and relevant application areas from both academic and non-academic perspectives including the humanities and science, art and design, and all related (interdisciplinary) fields.
In past years of Info+, presentations have covered a broad range of topics in information
design
and
visualization, including:
General topics:
- Ethical considerations;
- Design processes;
- Education;
- Diversity and inclusion;
- Modalities of data representations (touch, sound, taste, .. );
- Novel technology and AI;
- Social and political issues;
- The environment and climate action;
- Advocacy and law;
- Health and medical applications;
- Cultural analysis and collections;
- Digital humanities;
- Data journalism.
Keynote Speakers

Her work has been exhibited at major galleries including the V&A, the Design Museum (Designs of the Year 2016), Somerset House, the Wellcome Collection, Bletchley Park (all UK), the Centre Pompidou (Paris), and MoMA (New York), where her work is also in the permanent collection. Her latest illustrated book (I am a book. I am a portal to the universe., co-authored with Miriam Quick) has received multiple accolades, including winning the UK Royal Society's Young People's Book Prize 2021. She has also co-authored two previous books: Dear Data and the journal Observe, Collect, Draw!
stefanieposavec.com
Shannon Vallor is the Baillie Gifford Professor in the Ethics of Data and Artificial Intelligence at the University of Edinburgh, where she directs the Centre for Technomoral Futures in the Edinburgh Futures Institute. A Fellow of the Alan Turing Institute, Professor Vallor's research maps the ethical challenges and opportunities posed by new uses of data and artificial intelligence. Her work includes advising academia, government and industry on the ethical design and use of AI, and she co-leads the UKRI’s Bridging Responsible AI Divides (BRAID) programme. She is the author of Technology and the Virtues: A Philosophical Guide to a Future Worth Wanting (Oxford University Press, 2016) and editor of the Oxford Handbook of Philosophy of Technology (2022). She is the recipient of multiple awards for teaching, scholarship and public engagement, including the 2022 Covey Award and the 2015 World Technology Award in Ethics.
shannonvallor.net
The focus of her recent work has been on the implications of the historical social and spatial segregation of knowledge(s), with a particular emphasis on textiles and women's work. She has held residencies at renowned art and technology institutions such as La Gaîté Lyrique (Paris), V2_ Lab for the Unstable Media (Rotterdam), LABoral Cultural Center (Gijon) and EYEBEAM (New York). Her work has been exhibited in international venues such as the Ars Electronica Festival (Linz), ZKM (Karlsruhe), Siggraph (US), Microwave Festival (Hong Kong), Istanbul Design Biennial (Istanbul), Piksel Festival (Bergen), and the MAK - Museum of Applied Arts Vienna (Vienna), among others. In 2019, she was awarded the LACMA Art + Technology Grant by the Los Angeles County Museum of Art. She currently is Senior Research Fellow at the University of Applied Arts Vienna, where she runs the artistic research project "The Museum of Lost Technology" (2020 - 2024), funded by the Austrian Science Fund.
ebrukurbak.netProgram
Wednesday, 22 Nov |
|
|---|---|
| 9.00 |
|
| 10.30 | Coffee break ☕ |
| 11.00 | Workshops 1 |
| 12.30 | Lunch break |
| 14.00 |
|
| 15.30 | Coffee break ☕ |
| 16.00 | Workshops 2 |
| 17.00 |
I’ve spent my career in data visualisation working in ways that are considered ‘wrong’ or not in line with ‘best’ practices. But by adhering to best practices, could we be missing out on the *best* parts of our field through their inherent limitations? What new creative approaches can you discover when you intentionally set out to do the opposite of what you are ‘supposed’ to do, or use data visualisation for the ‘wrong’ ends? Using examples from my creative practice, this talk is a celebration of what there is to gain when we are wilfully, perversely, and joyously ‘wrong’ in how we as designers work with the data visualisation design process. |
| 18.30 | Exhibition opening |
Thursday, 23 Nov |
|
|---|---|
| 9.00 | Welcome |
| 9.30 |
In a world increasingly driven by immaterial data and technology, materials still have a powerful influence on our understanding of the world. In this talk, I will address the politics of data materiality by exploring a medium that has often been overlooked in techno-scientific and techno-artistic contexts: textiles and fibre-based structures. Spun, knotted, netted, woven, knitted or embroidered, these structures have been silent repositories of data and means of resistance in women's, nomadic and indigenous cultures. In my artistic practice, I have been investigating how we can unearth unborn technologies, tell untold stories, and inspire new and unforeseen points of departure for our future research. Through a personal journey that weaves together examples from my own artistic practice and the wider context, I will explore the interplay of textiles, data and power, revealing the lingering effects of historical bias as we work towards more inclusive futures. |
| 10.30 | Coffee break ☕ |
| 11.00 |
Session chair: Moritz Stefaner |
|
Info+ coming soon! |
|
|
Reading direction is essential for design, where people unconsciously direct their attention and make decisions. Yet, most of our visualisation knowledge is mainly based on LTR readers. In contrast, RTL readers constitute over 500 million worldwide and are left out of empirical investigations in the visualisation community. In practice, visualisation tools create LTR visualisations by default, while creating RTL visualisations depends on the designer's experience with RTL designs. Running a quick search on the internet for visualisation guidelines for RTL readers shows how designers struggle and sometimes receive conflicting and faulty information on how to mirror guidelines. The World Wide Web Consortium standardised web guidelines for RTL scripts, which could inspire the visualisation community to replicate that experience. However, we must critically ask which elements could be mirrored and which must remain the same. We also need empirical research replicating influential contributions that shaped our visualisation knowledge with RTL readers. |
|
|
This presentation centres around 'A Good Life,' an interactive visualisation tool designed to improve the quality of life of people with disabilities. Presently, the design of information technologies primarily focuses on enhancing administrative efficiencies and effectiveness, often overshadowing the individual and their unique needs and preferences. What sets this tool apart is its unique visual representation of an individual's activities over various timeframes, such as a week, month, or year. Simultaneously, it incorporates critical factors like cost, risk, and complexity. By reconceptualising the information landscape through innovative design, this tool facilitates improved communication of needs and preferences for individuals with disabilities. Additionally, it enables support teams, providers, and family members to advocate more effectively on their behalf. |
|
|
The practice of generative art involves an artist writing code that turns randomness into something that evokes the “feel” of information (nothing more boring than a field of white noise) and convey intent. Data visualization and -art are similar in that they’re also working with rules - often called “mappings” - transforming inputs into visuals. For them, however, the data being used is already preloaded with real-world patterns and the intention is often nothing more than undistorted representation. In this talk, I'll compare and contrast the three rule-based fields of data visualization, data art and generative art with a focus on the latter. An in-depth look at generative art can provide the Info+ community with new inspirations for data-based practices as well as help broaden the understanding of how to create representations that evoke emotions and meaning beyond the underlying information. |
|
|
Info+ coming soon! |
|
|
We present Olli, an open-source library for converting existing data visualizations on the web into keyboard-navigable structures containing descriptions at varying levels of detail. With Olli, users read an initial summary of the chart, and use the arrow keys to navigate into the chart to explore sub-sections in more detail. For example, a user could highlight the x-axis to read a description of its scale, and then traverse the subsections along the axis individually to understand how data is distributed. If they are interested in a particular section, they can access a table of the selected data to read specific data values. We demonstrate how practitioners can easily use Olli to make existing charts more accessible, and how screen reader users benefit from self-guided exploration using structured textual representations. |
|
| 12.20 | Lunch break / Exhibition |
| 14.00 |
Session chair: Andy Kirk |
|
The presentation is about the visualisation of science in information books for young people. It will include images of Marie Neurath’s ‘colour books for children’ published by Max Parrish between the end of the 1940s and the 1970s. It suggests that the way Marie Neurath explained complex information through charts and diagrams might be applied today to help children to understand issues key to a sustainable future. Marie Neurath (Reidemeister) worked with Otto Neurath to develop Isotype (International System of Typographic Education) in 1920s Vienna. The terms ‘transformer’ and ‘transformation’ were originally used in Vienna by the Neuraths to describe the process that today many of us would describe as information design. After Otto’s death in 1945 Marie applied the Isotype method and system to explanations about science in books for young people. She and her team combined ‘experience of a special kind of teaching, research and highly organised design’. |
|
|
Data literacy is an increasingly important skill for society as it enables people to understand, evaluate and effectively use data to interpret, analyze and communicate information. In this sense, higher education institutions have updated their curricular structures to incorporate Data Visualization. This includes courses and faculties in the scientific area of Communication that do not necessarily offer basic knowledge in related areas such as Design or Statistics. By default, these are students trained in oral and written communication skills, across different media, but with limited skills in data collection, analysis and visualization. In this presentation, we will share a three-step methodology called CAD (Context, Application and Challenge) with the description of strategies and practices used to teach data visualization to non-designers. Based on sharing experiences at a Communications faculty in Portugal over the past three years, we propose a reflection on how we should adapt teaching techniques and methods for non-designers and take advantage of the opportunities that this difference in backgrounds can provide. |
|
|
How does one become a Data Visualization in News Media? Nineteen interviews with industry professionals show it is mainly through self-teaching. Chartbites aims to fill the knowledge gaps that data journalists, graphic reporters, and infographic designers feel. This project results from a Ph.D. research that focuses on developing sustainable workflows for Newspapers and Magazine professionals, which have ventured heavily into digital reporting in recent decades. By working directly with users, we designed a three-part pedagogically-driven project composed of a book, videos, and workshops. Each part explores critical thinking, the design process, and a taste of theory and history—all content derived from interests proposed by the interviewees. Chartbites exists to incite questioning and dialogue, exercise designerly ways of producing visualizations, and highlight information of historical or ethical bearing. Its purpose is not to substitute higher education but to share knowledge for highly busy yet eager DataViz professionals in News media. |
|
|
This presentation delves into 'Poetic Data', an undergraduate course taught at the School of Museum of Fine Arts at Tufts University in Spring 2023. It focused on the intersection of data visualization and art within the realm of immersive media, with a specific focus on augmented reality (AR). The presentation entails course design, outcomes, acquired knowledge, and reflective insights. In the class, we explored the creative implementation of AR in data and storytelling, showcasing its transformative potential in this dynamic intersection of technology and creativity. This pilot class functioned as a testing ground for innovative tools and learning methodologies, with the prospect of being incorporated into subsequent semesters. The course design was guided by two inquiries. How does AR enhance data visualization and storytelling, and what tools and techniques can be used effectively in this context? What theoretical understanding and practical skills do students need to design AR experiences with data? |
|
|
When I teach students about visualizations, I might begin with a very broad definition: data visualizations are a consistent mapping between data values and visual components. This broad definition certainly encompasses the kinds of charts and graphs which first come to mind when imagining a visualization, but what about memes which borrow the language of data visualization to talk about dating people with particular astrological signs (e.g., in a pie chart)? Drawing from Feminist scholar Sara Ahmed’s work on use and queer use, in this presentation I will argue that representing data visually is a required, but not sufficient, condition for something to be considered a “data visualization.” I will offer data visualization memes as a case study to explore the complexity of defining what a visualization is based on how it is (intended to be) used and propose that both intended and queer uses are worth studying. |
|
|
The central theme of the presentation titled "Anthropological mapping in information visualization. Case study: Iconographic record of the geek, drag, and cholombiana youth cultures in Monterrey" is the use of anthropological mapping and information visualization techniques to explore and depict the geek, drag, and cholombiana youth cultures in Monterrey. The presentation focuses on creating iconographic records that capture the characteristics, expressions, and symbolism of these cultures, and how this information can be visualized and analyzed to gain a better understanding of their dynamics and meanings within an anthropological context. |
|
| 15.30 | Coffee break ☕ |
| 15.50 |
Session chair: Marian Dörk |
|
Decoloniality is gaining traction across various academic fields, interested in pushing the boundaries of knowledge production beyond Western perspectives. Notable discussions in areas such as data feminism, critical cartography, missing data, and data bias have also propelled this movement. Despite these advancements, the field of information visualization has notably underexplored the theme of decoloniality. Our planet faces multiple crises such as climate change, misinformation, and inequality, which demand alternative perspectives. Thus, it is imperative to discuss how the dominance of so-called Northern epistemologies encroaches upon other methodologies and extracts profits in the process. This advancement led to the destruction of some local forms of knowledge, prevented the emergence of others, and hindered the preservation of biodiversity. In an epoch when scientific knowledge and truth are questioned, it is relevant for the information visualization community to open up new modes of knowledge creation. Understanding decoloniality can help with this intention. |
|
|
Info+ coming soon! |
|
|
Info+ coming soon! |
|
|
This interdisciplinary work attempts to propose a radical way of treating a common challenge in information design and data visualization: missing data. Through an exchange among different epistemological fields, theories and methods, our work challenges the assumption that data should be clean or whole, and instead advocates for the possibility to treat missing data as its own knowledge object. We focus these lenses on the astrovisualization software OpenSpace that uses astronomical data from around the world to provide the general public the opportunity to travel through space during live, interactive planetarium shows. This data does not capture the full universe due to the limitations of current observational instruments, and narrators of OpenSpace planetarium shows fill the gaps with stories of why the data is missing. Our analysis of OpenSpace reveals an opportunity to use missing data as an opportunity to explore the story within the story – the reasons for the missingness in the first place. |
|
| 18.00 | Exhibition |
| 19.00 | Dinner |
Friday, 24 Nov |
|
|---|---|
| 9.00 | Welcome |
| 9.10 |
Session chair: Georgia Panagiotidou |
|
Info+ coming soon! |
|
|
Info+ coming soon! |
|
|
Google Arts and Culture tasked us with designing an interactive fantasy literature map, drawing from a vast dataset of over 100,000 books, leading to our project, ""An Ocean of Books."" This is a behind-the-scenes exploration, revealing the intricate creative and technical challenges we faced working on this very peculiar endeavour: creating an explorable map of literature from thin air. It required bending some rules and playing with the limits of conventional web mapping and GIS technologies, including Mapbox GL, vector tiles, QGIS, and tippecanoe. Furthermore, we'll dissect this early creative AI experiment, addressing its outcomes and the ensuing debate. |
|
|
The names of our streets are not harmless urban elements. They have symbolic solid power and are permeated with the cultural values behind the decision-making processes, the legitimation of the past, and the construction of a collective historical memory of that past. Who is visible, and who remains invisible in the EU street names? Mapping Diversity answers this question. By combining open data and visual storytelling, readers can explore all the facts about the gender gap in major European cities' street names. Visitors can read summary statistics about the street names across European cities and drill down in maps to discover specific street name dedications. With a click, visitors generate social-media cards to start a conversation beyond that of an individual's screen about the gendered dynamics behind street names, to populate the digital sphere with provocative facts about the stereotypes and power dynamics embedded in our urban lives. |
|
|
Lely is working toward a sustainable, enjoyable, and profitable future for dairy farmers. A part of this involves shortening the figurative and physical distance between consumers and their products. Sustainability translates into fewer food miles, but also a stronger connection between famers and consumers, leading to greater appreciation for the product. To enhance the connection between farmers and consumers, we've created the platform: Mijn Boerderij (My Farm). Mijn Boerderij is the first platform to make fresh milk and yoghurt, its origin and production process fully traceable and transparent. Multiple (real-time) data sources are utilized to generate a unique visual story for each batch of milk or yogurt. In this presentation, I'll show you the various data sources used in the platform and how they are combined not only to narrate the story, but also to create the visual look of each story. |
|
|
Lets Play with data! Exploring the relationship between data and citizens in South America, through playful participatory experiences that take place in public space and aims to spark meaningful conversations so citizens can make good decisions. This approach isn’t about pumping out pristine graphics worthy of the New York Times, it’s about encouraging people on something much more important: critical thought for change. ¿How can we approach difficult topics about the world we live in to citizens? Designing data devices to trigger meaningful conversations, allowing citizens not only to talk, express themselves but also receive important information that will open up their minds to new perspectives. Sometimes one small piece of data can trigger one powerful conversation that changes everything. |
|
|
In this presentation, we introduce an interaction technique for flowcharts that combines progressive disclosure, linear storytelling and open-ended exploration. This technique is applied to a flowchart taking viewers on a journey through the diverging paths of our collective climate predicament, published as part of the recent book “I Want A Better Catastrophe: Navigating the Climate Crisis with Grief, Hope, and Gallows Humor”. We investigate how an interactive version of this chart can make its contents and connections explorable, narratable, and ultimately relatable. Instead of treating author-driven and reader-driven approaches as irreconcilable experiences of either storytelling or exploration, the presented flowchart prototype combines an audio narration and interactive elements within an integrated interface, allowing both linear as well as non-linear readings of the chart. We present the design principles of this interface and share observations and learnings from the deployment of the project. |
|
| 10.30 | Coffee break ☕ |
| 11.00 |
Session chair: Paolo Ciuccarelli |
|
Visualising otherwise is a respond to current trends in visualisation culture, exploring data representation from media and image studies. It challenges the dominant model of visualisation that rigidly presents data, proposing an alternative diagram-theoretical approach. Hence, we see visualisations as ordering processes, revealing their designed reality. By contrasting affirmative and critical perspectives, it emphasises transformative concepts over rigid efficiency and optimisation. The presentation seeks critical models to explore limits and possibilities of visualisation as a cultural technique. If we know about the dependencies of the design process, how can we design data visualisations differently? |
|
|
Greetings from... is an exploratory format in which data visualization becomes a tool for a critical analysis of realities, sounds, scents, and rhythms. The interpretation through visual models aims to communicate opportunities and criticalities that a context offers at a design level; the final result is the construction of a databook, an artifact that allows the transformation of information into awareness, knowledge, and wisdom for actions of significant impact. By presenting the case study Greetings from Naples the presentation reflects on the unexpected facets that can be extracted from a context and how visual representations can convey them. It also explore the databook as an experimental tool with multidimensional and collaborative configurations. |
|
|
"What brings you joy?" For most people, dashboarding products is not the first thing to come to mind. Yet, our interdisciplinary product team set sail to provide a more joyful building experience for our users. Today, our dashboarding and app building capabilities enable enterprises to fully understand how their core business processes run and find the hidden value opportunities, before taking intelligent, automated action to improve performance. We realized that whilst we build a powerful and scalable authoring product that produces visually appealing visualizations, the act of building was associated with a steep learning curve, extensive training and usage of documentation, causing frustration and making our users feel overwhelmed. But what does joy even mean? In this presentation I want to walk you through our work-in-progress on offering a more joyful building experience for visualization authors and app builders. |
|
|
In 2018 we worked with MSNBC to design and implement Steve Kornacki's "big board" for the midterm elections. The "election map" has been used in every election since then. This talk will cover the design journey from user research to on-air coverage. |
|
|
We live in a data-intensive society with visualization being the main(stream) mode of representation. Yet, the struggle in engaging the public and driving change is significant, with complex, socially relevant phenomena especially. More holistic approaches in designing with data produce significant results by creating synergies between senses and modes of representation. In this context, data sonification gains momentum as a fundamental component of embodied experiences and a proxy of their inherent complexity. For a deeper understanding of the intersections between sensorial modalities, we performed a review of 452 cases from the Data Sonification Archive: the most comprehensive curated collection of sonification projects. The analysis shows a significant diversity of topics, functions and communicative intentions. At Information+, we will also reflect on the status of data sonification, its interplay with visualization, and its transition from a niche analysis technique to a medium for more humane data experiences. |
|
|
Nowadays, visualizations are prevailing in science communication. As we associate Sushi to Japanese cuisine, some particular science fields can be stereotypically matched to certain types of visualizations. We associate maps of 3D buildings or animated traffic with Urban Studies. Micro-level visuals of cells or viruses with biology and medicine. Is there a visualization type for complexity science? In this talk, I’ll illustrate the process and conceptual challenges in presenting research in complexity science for diverse audiences. I’ll also showcase a collection of visualizations I’ve created for complexity science research, including an experimental work that won first place in the 2023 World Dataviz Prize. Furthermore, I will share insights and visualization strategies developed through collaborative projects involving over 30 participants from diverse backgrounds during the "Visualizing Complexity Science" workshop I organized in August 2023 in Vienna. |
|
| 12.20 | Lunch break |
| 14.00 |
Session chair: Mandy Keck |
|
In the dynamic world of data visualization, diverse paths often converge to create captivating narratives. Alenka and Matthias, once biochemists turned data visualization professionals, share their transformative journeys. Making the switch to dataviz from being academic fellows in Sweden, they talk about their paths when their passions for visualization ignited. Alenka's fascination with molecular intricacies pushed her beyond traditional charts, merging her love for molecular structures with artistic visualization. Matthias, on the other hand, found his passion during his postdoc tenure in Stockholm, using data art to communicate complex information effectively. Their stories reveal shared enthusiasm for impactful visualizations, bridging scientific exploration and community engagement. Regardless of their academic origins, their journeys underscore the power of pursuing true passions. In this presentation, we explore Alenka and Matthias' parallel experiences, celebrating diverse paths into data visualization. We invite the community to reflect on their unique journeys for shared understanding and discovery. |
|
|
Visitors of the 2023 info+ website became part of a visualization that showed user traces on the website. In the physical world, traces of people are everywhere — broken twigs as evidence of a new path in the forest, graffiti tags on public restrooms, or a light shine on walls where naturally oily hands touched the surface. Intentional or not, a person’s interaction with their environment becomes part of that environment. As ubiquitous as material traces are, visual digital traces remain surprisingly bare. Our experiment is an impulse towards using digital traces as design material in visualization: They blur the boundaries between visualization authors and readers; complicate questions surrounding authorship and agency; change the ways in which visualizations are read; and trouble the notion of participation in personalized data displays. |
|
|
This presentation reports on the preliminary results and discussion of the CHI 2023 “Data as a Material for Design” workshop. The workshop attracted 34 submissions and 38 multi-disciplinary participants. The workshop consisted of activities that engendered discourse that palpated the edge of our understanding of data and its properties as a material for design. This included two asynchronous pre-workshop events, populating a spectrum ranging from conventional to evocative with examples of works that engage with data, and responding to four pre-set questions; two free-flowing sessions in which grouped participants discussed their submissions as well as synthesising the material from the asynchronous events into previously “unknown” questions. The participants then organised themselves around these questions for a craft-based activity where they expressed their responses through physicalised concepts. These included data masks, representations of data through time, and a performative piece entitled “data tracer”. |
|
|
Participatory approaches have been successful in giving underrepresented actors a voice, and thus result in a more inclusive story. A speaking example is citizen science, in which the audience is invited to participate in scientific studies by contributing data, which often form the base of a news story item. Yet how to make the participation part of the actual data storytelling is still unclear. We will give an overview of how different levels of participation can be embedded within the narrative structure of data stories. Together with Belgian journalists and media professionals, we collected examples that can be implemented in newsrooms today, such as existing inspiring news items that combine reporting citizen science results with call-to-actions to contribute data or stand-alone scrollytellings that require data input from the user. These examples with limited requested contribution by the audience serve as a stepping stone to other, more elaborated participatory data story formats, such as open game worlds as Minecraft in which children collaboratively create a story that integrates data visualisation of air pollution or a real-life physical installation to invite humans to contribute birth dates of their loved ones and memories of that day in relation to weather data. We will present these examples in an interactive, participatory way. |
|
|
Skilled designers are able to make instrumental judgments about which tools and methods are appropriate for given situations—including the discernment of when to use them, under what conditions, and in which ways they should be extended, modified, or created to fit the situation. Because judgment making is personal and situated, there have been few attempts by researchers to study the formation and development of instrumental judgments in data visualization education and practice. In this talk, I will introduce some vocabulary on design judgment, share data from an ongoing study of data visualization practitioners, and discuss challenges for knowledge sharing between researchers and practitioners. Researchers will learn about the nature of design practice including strategies for engaging in practice-led research. Practitioners will learn concepts that may sensitize them to aspects of their practice and help them reflect on the nature of their own processes and methods. |
|
|
Many members of the Information+ community have engaged in interdisciplinary participatory visualization design in the past and more will do so in the future. Interdisciplinary collaboration is more difficult without a common language to talk about participatory visualization design. Understanding how potential collaborative partners think and communicate about participatory visualization design will make future collaborations more enjoyable and productive. I present results from a mini-literature review that shows how authors from different backgrounds (including healthcare, human-computer interaction, visualization, and design) write about co-designing health information visualizations with and for older adults. Attendees will learn what draws different researchers, designers and stakeholders to participatory visualization design, as well as the common challenges and benefits of such approaches. Attendees will have the opportunity to reflect on their own practices in participatory visualization design and understand how their perspectives might interact with the perspectives of their potential collaborators. |
|
|
We co-constructed a data physicalization called "Wound Up in a Pandemic", with locals at a community arts centre. Local community perceptions about data visualizations are little explored in the field. Therefore, we designed a data physicalization as an active participatory design approach for public engagement to explore community interactions with data. We placed a wooden frame in a public gallery, and together with the visitors, added national survey data about people’s trust in information about COVID-19. Participants could optionally add anonymous nationwide data or their own responses to the survey by weaving 1-5 loops of yarn around six wooden posts that represented different information sources. Through observations and interviews with participants, we learned about personal and community perceptions of the data physicalization in the context of people’s daily lives, histories and cultures. Our exploration revealed the potential of data physicalization as an active community experience for research and design. |
|
| 15.20 | Coffee break ☕ |
| 15.50 |
Dietmar Offenhuber: "Autographic Design - the Matter of Data in a Self-inscribing World" Book launch (MIT Press) Till Nagel, Sam Huron: "Making with Data: Physical Design and Craft in a Data-Driven World" Book presentation (CRC Press) The talks are located at inspace. |
| 15.50 |
New AI tools for generating images, video, text and sound are rapidly transforming how information is expressed and communicated in our societies. What human capabilities do these tools support, and what human capabilities do they potentially diminish? What do we gain, and what do we lose when the primary mode of human expression moves from creation to curation? This talk will explore the ethical implications of automating the visualisation and generation of meaning from data. |
| 17.00 | Closing |
Show (expired) call for Presentations
We are explicitly calling for presentations that will engage the community in timely, thought-provoking, and interdisciplinary conversations about information design and data visualization, including their design, assessment, and implications for society. We are looking for diverse positions and topics, and we especially encourage submissions from practitioners, artists, academics, and others that are not usually represented at visualization and data-oriented venues.
We are seeking presentations that motivate, inspire, and challenge the community, and that most importantly have the potential to spur cross-disciplinary conversations and ideas. Presentations can take many forms, including provocations, reflections, challenges, experiments, and works-in-progress. We invite new perspectives, ideas, or cross-disciplinary connections, and welcome presentation experiments that play with different modalities, performances, and audience participation.
Accepted submissions will be presented in-person (no online) in a single-track at the conference. Presentation lengths can vary between 5 and 15 minutes, followed by open discussions with conference participants. The program will be curated by an international programme committee and a jury, with an emphasis on promoting cross-disciplinary conversations.
Submission
Proposals for a presentation must include a pitch statement (max 3000 char) that considers the following questions:
- What is the topic of your presentation?
- What will attendees learn or experience?
- Why is it important for the Info+ community?
Your proposal must also include a description of the anticipated form of your presentation (max 1000 char): is it a provocation, a reflection, a challenge, an experiment, a work-in-progress? Will there be non-traditional components to the presentation? What is the proposed length of your talk: 5-10 mins, 10-20 mins?
Optionally, proposals may include (static) materials to help reviewers assess the potential of your presentation. These materials must be uploaded in the form of a PDF.
Workshops & Activities
Information+ features 11 workshops, that are all running on Wednesday, Nov. 22, 2023. You can find more information about the workshops, their organizers, and the schedule below.
Please note: All workshops are fully booked; registration is closed.
Examining and visualising large datasets, such as user analytics for a web-based video service, can yield useful insights and help designers improve the effectiveness of online and offline services. When we explore such data, we’re often interested in not just what actions people performed but whether those actions enabled users to meet their needs. The aim of this workshop is to explore how these datasets might be examined in a way that includes such human values. This could enrich the insights derived from the analysis, by determining which core human needs and drivers are being fulfilled, or undermined. Putting the people behind the data at the centre of the analysis in this way, helps avoid the user reflected in the data being reduced to just their clicks and views. The workshop will give participants the ability to discuss with other practitioners and researchers the kinds of values they wish to find in their data and explore ways of dealing with their data which could support these kinds of analyses.
Date:Wednesday, Nov. 22; 9:00 - 12:30Venue:Room Braid; Pleasance Courtyard; 60 Pleasance Edinburgh EH8 9TJParticipants:20
The goal of this workshop is to frame and support a discussion around what an ethical data practice means today. Participants should feel supported and informed to consider these issues in the context of their own practice, interests and experience and create visualisations that reflect their concerns. Participants will engage in a discussion about data ethics and advocacy, learning more about these issues and sharing their experiences with other community members. They will also make an output which articulates some of their perspectives, stimulating discussion and debate in the workshop and wider conference.
Date:Wednesday, Nov. 22; 9:00 - 10:30Venue:Room Lomond; Pleasance Courtyard; 60 Pleasance Edinburgh EH8 9TJParticipants:20
The workshop "What Cannot Be Seen?“ is set up to be a conversation among data visualisation practitioners to inspire a critical perspective on data visualisations, considering them not only as mere technical or representational exercises but also as cultural techniques. We’ll delve into the intricate tapestry of data representation, uncovering inherent limitations and their far-reaching individual and societal implications – to look at the complex assemblages behind the data images.
Spanning three phases, the workshop commences with input presentations, spanning diverse philosophical perspectives on data and its visual portrayal. This knowledge sets the stage for the second phase, where participants dissect existing visualisations – personal or inspirational – dissecting strengths, limitations, and kindling enriching discussions. The final phase widens the vista to encompass societal dimensions. Addressing visualisation challenges evolves into an exploration of their profound societal impact, fostering strategies to transcend limitations. The workshop seamlessly weaves theory and practice, nurturing a discerning approach. It empowers participants to adeptly navigate the cultural and societal nuances entwined with data visualisation.
The workshop bridges the theory-practice gap in visualisation design, offering an alternative data visualisation vocabulary. By examining limitations and consequences, we encourage holistic thinking beyond technical aspects. We’ll embrace cultural and societal dimensions to provoke a more self-reflective visualisation practice. Equipped with a critical lens, participants emerge as conscious, informed practitioners, enriching the broader data visualisation discourse.
Website:Kim Albrecht, Paul HeinickerDate:Wednesday, Nov. 22; 11:00 - 12:30Venue:Room Munro; Pleasance Courtyard; 60 Pleasance Edinburgh EH8 9TJParticipants:20
The goal of the workshop is to give the participants a general knowledge and power to implement a scrollytelling data article from scratch. The expected outcome is that all participants will implement a small data story of a given topic and database in the form of scrollytelling. They will get familiar with the concept, structure and coding of a scrollytelling project.
- introduction to scrollytelling: examples and best practices
- narrative structures in scrollytelling
- map-based and chart-based scrollytelling using Mapbox GL JS and Flourish.studio
- structure of code wireframe
- introduction of dataset
- data and map design
- putting it all together
- troubleshooting
In Hungary, I have led several workshops of data design and data interactivity. I have experience in teaching as well, as I am giving lectures at universities at Budapest. I have experience in making scrollytelling data articles. previous work of such kind include: Earthquake atlas, Pope Francis in Hungary, Canopy Promenade 3D
Website:Krisztián SzabóDate:Wednesday, Nov. 22; 9:00 - 12:30Venue:G07 A; Informatics Forum; 10 Crichton Street, Edinburgh, EH8 9ABParticipants:20
“For My Friend, Earth: Rethinking Data and Behaviour in a Plastic World" is a workshop that will lead participants in a process of generating and experiencing data as a means to surface common values and imagine actions to reduce and transform contemporary issues of plastic waste. Combining tactics of Data Biography, Data Persona, and Data Embodying with design methods like probe kits and co-creation, this workshop will explore ways to rethink data from 'data as a resource for information processing or analysis' to 'data as a medium that can lead to social change'. Participants will record their plastic use through a probe kit that is carefully designed to document individual data, reflections, and behaviours. The filled out kits will act as the basis for the workshop which will follow a series of co-creative activities such as Behaviour Reasoning, Data Meshworking, and Co-Speculating. Through this workshop, participants will learn how to experience data, how to extend their perspectives and actions into the larger social and environmental context, and how to build tools to take action toward a more sustainable community.
* Participants will receive a digital probe kit prior to the workshop and will conduct plastic data tracking for 3 days.
Website:Jihyun Park, Workshop SiteDate:Wednesday, Nov. 22; 9:00 - 12:30Venue:Room Munro; Pleasance Courtyard; 60 Pleasance Edinburgh EH8 9TJParticipants:20
Memes, often characterized by their humorous and viral nature, have become a widespread form of online expression, shaping the way we engage with and understand contemporary issues. “Memes for Feminist Data Literacy” explores the immense potential of memes as a critical and transformative tool for feminist data literacy.
Acknowledging the uneven distribution of power, control and knowledge over data, feminist data futures should be seeked through critical and creative literacy methods, mediums, tools and tactics that unpack, communicate and challenge the existing imbalances rather than perpetuating the status quo and the matrix of domination.
The workshop will provide a collaborative space for participants to co-create memes for various aspects of feminist data literacy. By embracing the vernacular creativity of meme culture, we will explore the power of memes in sparking critical conversations, raising awareness, mobilizing communities, and advocating for feminist data futures in an accessible and engaging manner.
In a this workshop, we will delve into how memes; an online medium that has been predominantly driven by and amplifying the voices of patriarchal norms and communities, can be adopted to challenge the inequalities in access to data literacy, introduce feminist perspectives to the data and amplify underrepresented perspectives by actively creating memes and contributing to the feminist data literacy meme archive.
Website:Sinem Görücü, FeministDesign.coDate:Wednesday, Nov. 22; 9:00 - 12:30Venue:G07 B; Informatics Forum; 10 Crichton Street, Edinburgh, EH8 9ABParticipants:50
Typically the social interactions at conferences are limited to informal discussions during breaks in between focused activities. The goal of this workshop is to create opportunities for connection among the Info+ community in a dedicated and structured environment.
To structure the workshop activities, participants engage in reflective physicalization prompted by values i.e. what someone considers important and drives their decision-making in the context of their work. With this approach to physicalization i.e. the process of mapping data to physical form, participants encode data regarding their academic and/or professional interests collaboratively and synchronously. As a starting point, they draw on values as elements that foreground the socio-technical context of knowledge creation and are often implicit, rather than up for critical debate.
Date:Wednesday, Nov. 22; 14:00 - 16:30Venue:Room Munro; Pleasance Courtyard; 60 Pleasance Edinburgh EH8 9TJParticipants:50
The workshop takes inspiration from the #journaldataviz challenge Martina Zunica and Alenka Gucek founded more than one year ago. The main goal of the workshop is to practice dataviz skills, challenging ourselves in data storytelling, starting from personal data. They will create a data viz, telling the story behind the data they collected. The main goal is to make the data viz speak by itself.
During the workshop, the participants will collect data about what's around them, letting them focus on themselves, and getting into an introspective process. They will be led to look at things from everyday life from a different perspective, changing the way they perceive themselves and their habits.
Website:Martina Zunica, Journal DataViz ChallengeDate:Wednesday, Nov. 22; 14:00 - 16:30Venue:G07; Informatics Forum; 10 Crichton Street, Edinburgh, EH8 9ABParticipants:50
In Europe, every medicine package contains a leaflet. This leaflet must mention the frequency and severity of side effects. At the moment, this is done through obligatory phrases like: ‘Very common: may affect more than 1 in 10 people’, ‘Common: may affect up to 1 in 10 people’ and ‘Uncommon: may affect up to 1 in 100 people.’ Most patients don’t understand these descriptions and overestimate the risks of taking a medicine. This information is provided only on paper and only in words. It is not digital and not visual.
The goal and challenge of the workshop is to visualise the “frequency” and “severity” of side effects to inform patients in a balanced manner. The data from clinical studies for one medicine will be used as a basis. We’ll discuss the practical issues, look at a few existing examples, and explore digital and visual approaches. How can we inform patients about side effects in a balanced manner that is understandable and usable? What could interactive information about side effects look like?
Website:Karel van der Waarde, LinkedInDate:Wednesday, Nov. 22; 14:00 - 16:30Venue:Room Braid; Pleasance Courtyard; 60 Pleasance Edinburgh EH8 9TJParticipants:20
Our workshop's objective is to develop sustainable methods for creating data physicalizations using reusable and biodegradable materials, through the introduction of the ZeroWaste PhysKit. It aims to counter the environmental impact of conventional data physicalization creation through practices that emphasise the responsible and reflective use of materials. Participants will engage in group activities to craft their own eco-friendly data physicalizations, before discussing their experiences and opinions on the wider topic of sustainability in data physicalization creation. The workshop intends to foster knowledge sharing, discussions on the benefits and challenges of adopting zero-waste strategies, and identification of future opportunities for integrating sustainability into data physicalization education and practices. Our aim is for the workshop to inspire participants to rethink their approaches to workshops, teaching, and prototyping in the context of data physicalization. Furthermore, the workshop may lead to the formation of a Special Interest Group (SIG) focused on sustainability and data physicalization. Future research directions include enabling individuals to create their own ZeroWaste PhysKits and exploring similar sustainable approaches for dynamic physicalization designs.
Website:WorkshopDate:Wednesday, Nov. 22; 14:00 - 16:30Venue:Room Lomond; Pleasance Courtyard; 60 Pleasance Edinburgh EH8 9TJParticipants:20
Finding or creating appropriate visualizations that meet the design
goals can be
a challenging task. In this workshop, we introduce a hands-on
activity that
guides through the process of understanding the essential building
blocks of a
visualization to crafting design variations. This workshop builds on
the 'DNA of
Visualization' framework that helps designers to generate
visualizations options
and to guide design choices. This framework uses the metaphorical
concept of the
“Visualization zoo” that was introduced by Jeffrey Heer et al.,
along with the
idea of all visualization ‘species’ sharing a common ‘DNA’. By
defining the
fundamental building blocks of visualization, their
interrelationships and their
various combinatorial possibilities, the framework provides a method
for
deconstructing visualizations and a grammar that supports the
exploration of the
design space and guides the designer in finding appropriate
visualization
variations.
Building on a deconstruction and construction approach
demonstrated, for
instance, in the interface construction kit workshop, the workshop
will include
two phases to guide designers through the design process: (1) a
deconstruction
phase to help understanding a given ‘visualization species’ (chart
type) by
identifying its building blocks, such as the visual encoding
techniques, the
visual components and the types of information it encodes. (2) a
construction
phase that helps the designer to explore the design space to create
different
visualization variations. This design process is supported by a
grammar that
provides designers with guidance on how to combine VisDNA building
blocks.
The workshop is suited for practitioners and educators in the
area of
information visualization and design. It provides a grammar that can
be used to
understand the key aspects of a visualization and supports the
exploration of
the design space. The workshop material includes worksheets and a
guided process
to help designers to find an appropriate chart type for a given data
set and to
create and sketch other suitable design variations.
Date:Wednesday, Nov. 22; 14:00 - 16:30Venue:G03; Informatics Forum; 10 Crichton Street, Edinburgh, EH8 9ABParticipants:20
Exhibition

A design exhibition held at the Information+ conference
Information xyz celebrates the most recent contributions of our global community of practitioners, artists, and researchers. As part of the Information+ biannual conference, we share in the sometimes subtle, often challenging, but always intentional process of shaping data into form. For this year’s exhibition program, we present a collection that speaks to the interconnectedness of technology, environment, and humanity.
Find us at Inspace, at the Informatics Forum on
- Thursday, Nov 23rd: 12:30-6:30pm
- Friday, Nov 24th, 2-5pm
download the full conference catalog here (PDF).
We found four main critical themes across the fourteen pieces.
Focusing on the unseen—“Borders, Bullets and Books” exposes the harsh realities of conflict on education in the Kashmir valley. “Mapping Diversity” uses the digital landscape to dissect the complexities of gender and diversity in Europe. The more abstract visualities of “Post_Networks” value the spaces between connections, pushing us to consider the hidden traces left by networks in the digital age. “Macromicroscope” brings the unseen into focus, drawing attention to the consequences of human actions on biodiversity and climate, and the “Island of Loneliness” brings to the forefront the silent epidemic of loneliness magnified by social media.
Challenging social norms—“Though a patriarchy would privilege the changelessness—of the sun—over the inconstancy of the moon and you” questions societal norms about menstrual cycles, while “From my terrace” reflects on the modern struggle for work-life balance.
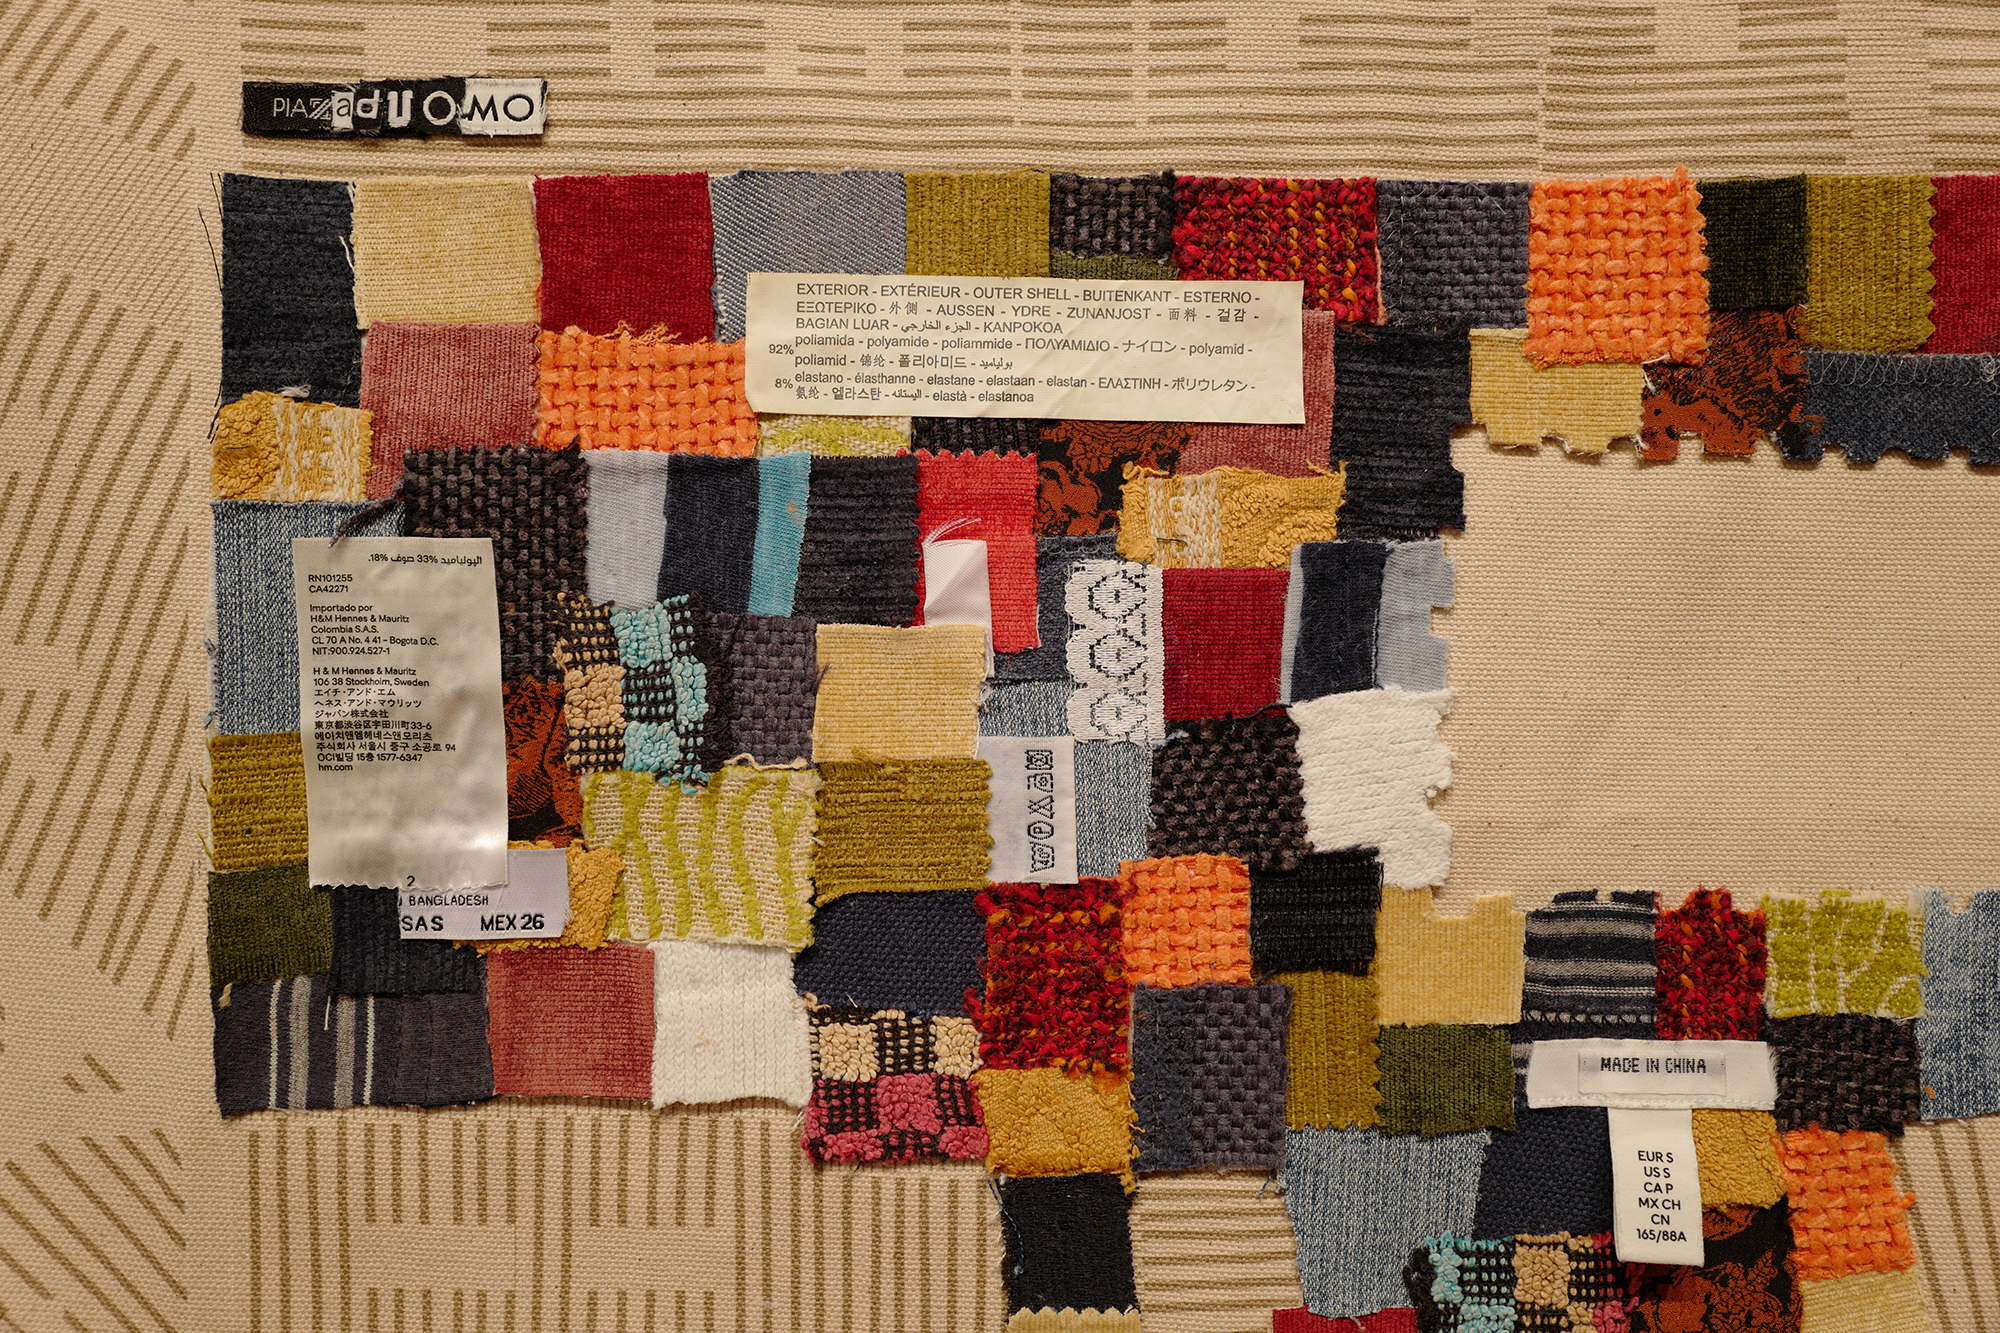
Our environmental existence—Carla Fernández Arce’s data-driven installation on imported fruits urges a reflection on our food choices, while “Back to Square One” confronts the issue of fashion waste, and Chloe Prock’s exploration of worn textile trade provides a stark look at the realities of fast fashion sustainability. By reflecting on the environmental impacts of pollution, “Ripple Effect” translates the contamination of water into an audio-visual experience.
Questioning media-Lastly, two critical works question traditional media of data visualization. While “Shine through Mars” renders the Martian atmosphere comprehensible through light, “Data-distortion exercises” will lead you through a hands-on, critical approach to data visualization.
Together, these data-driven works urge you to ponder the delicate relationship between our digital existence and the physical world, questioning established norms, and highlighting the often overlooked or unseen aspects of contemporary life.
Data-distortions Exercises

Ripple Effect: Communicating Water Quality Data through Sonic Vibrations
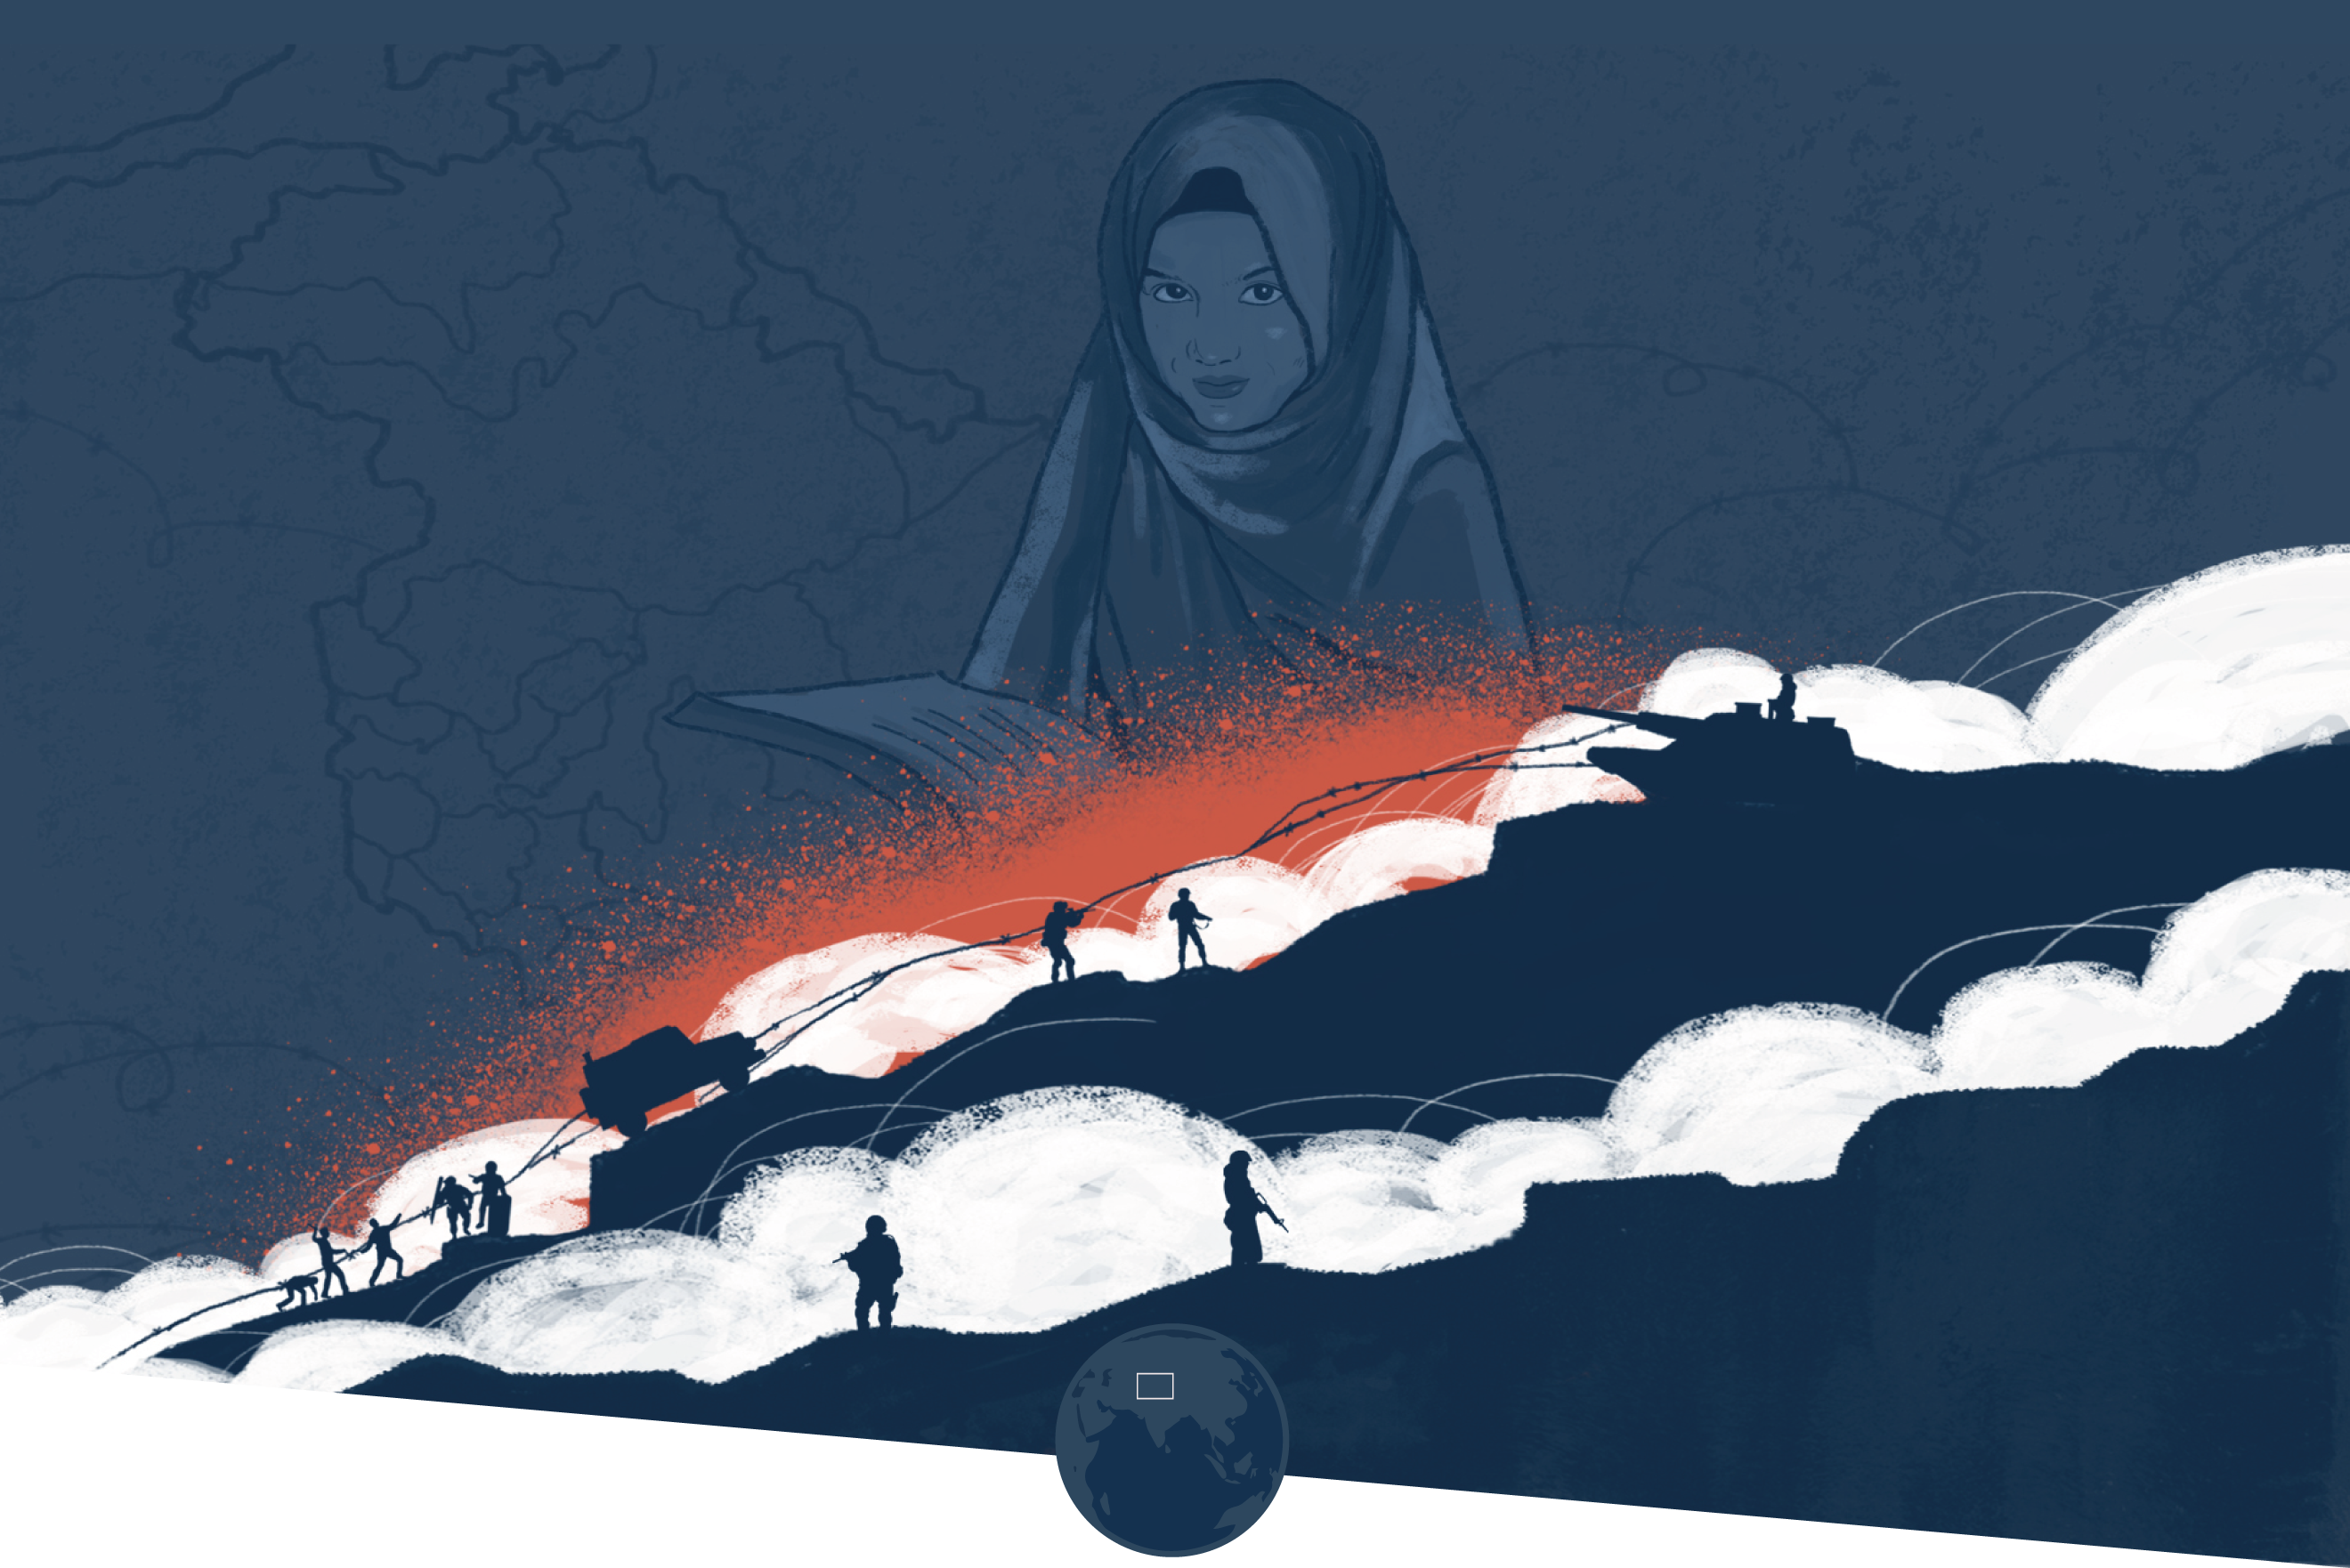
Borders, Bullets and Books

“Though a patriarchy would privilege the changelessness—of the sun—over the inconstancy of the moon and you”
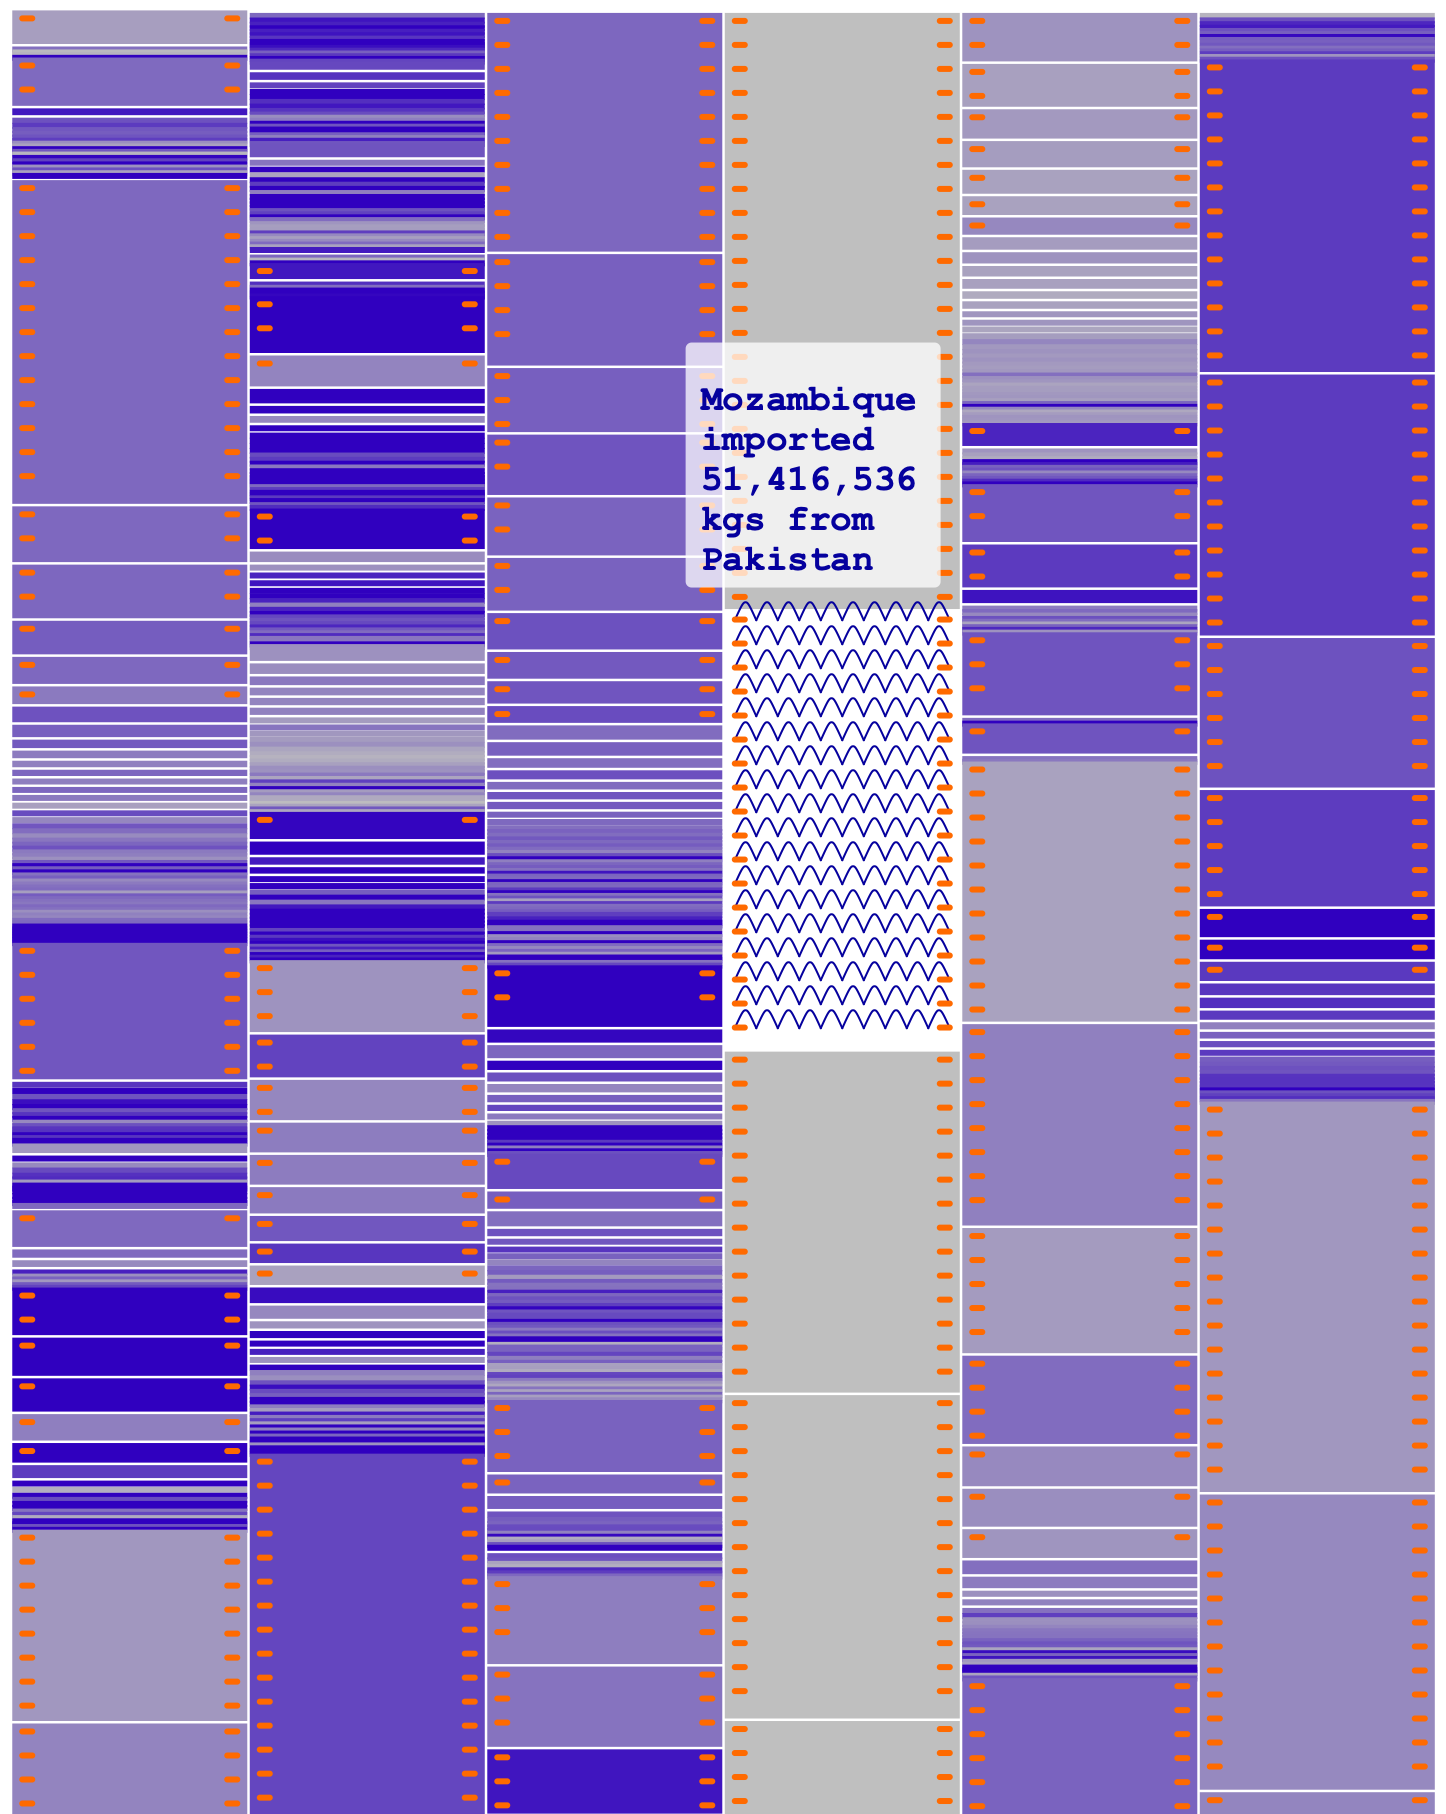
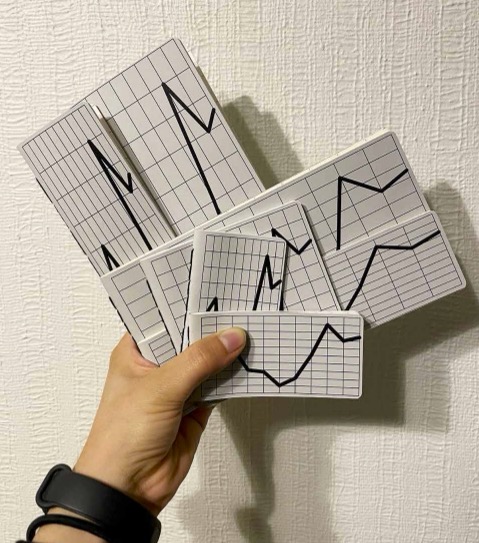
Visualizing the International Trade of Worn Textiles
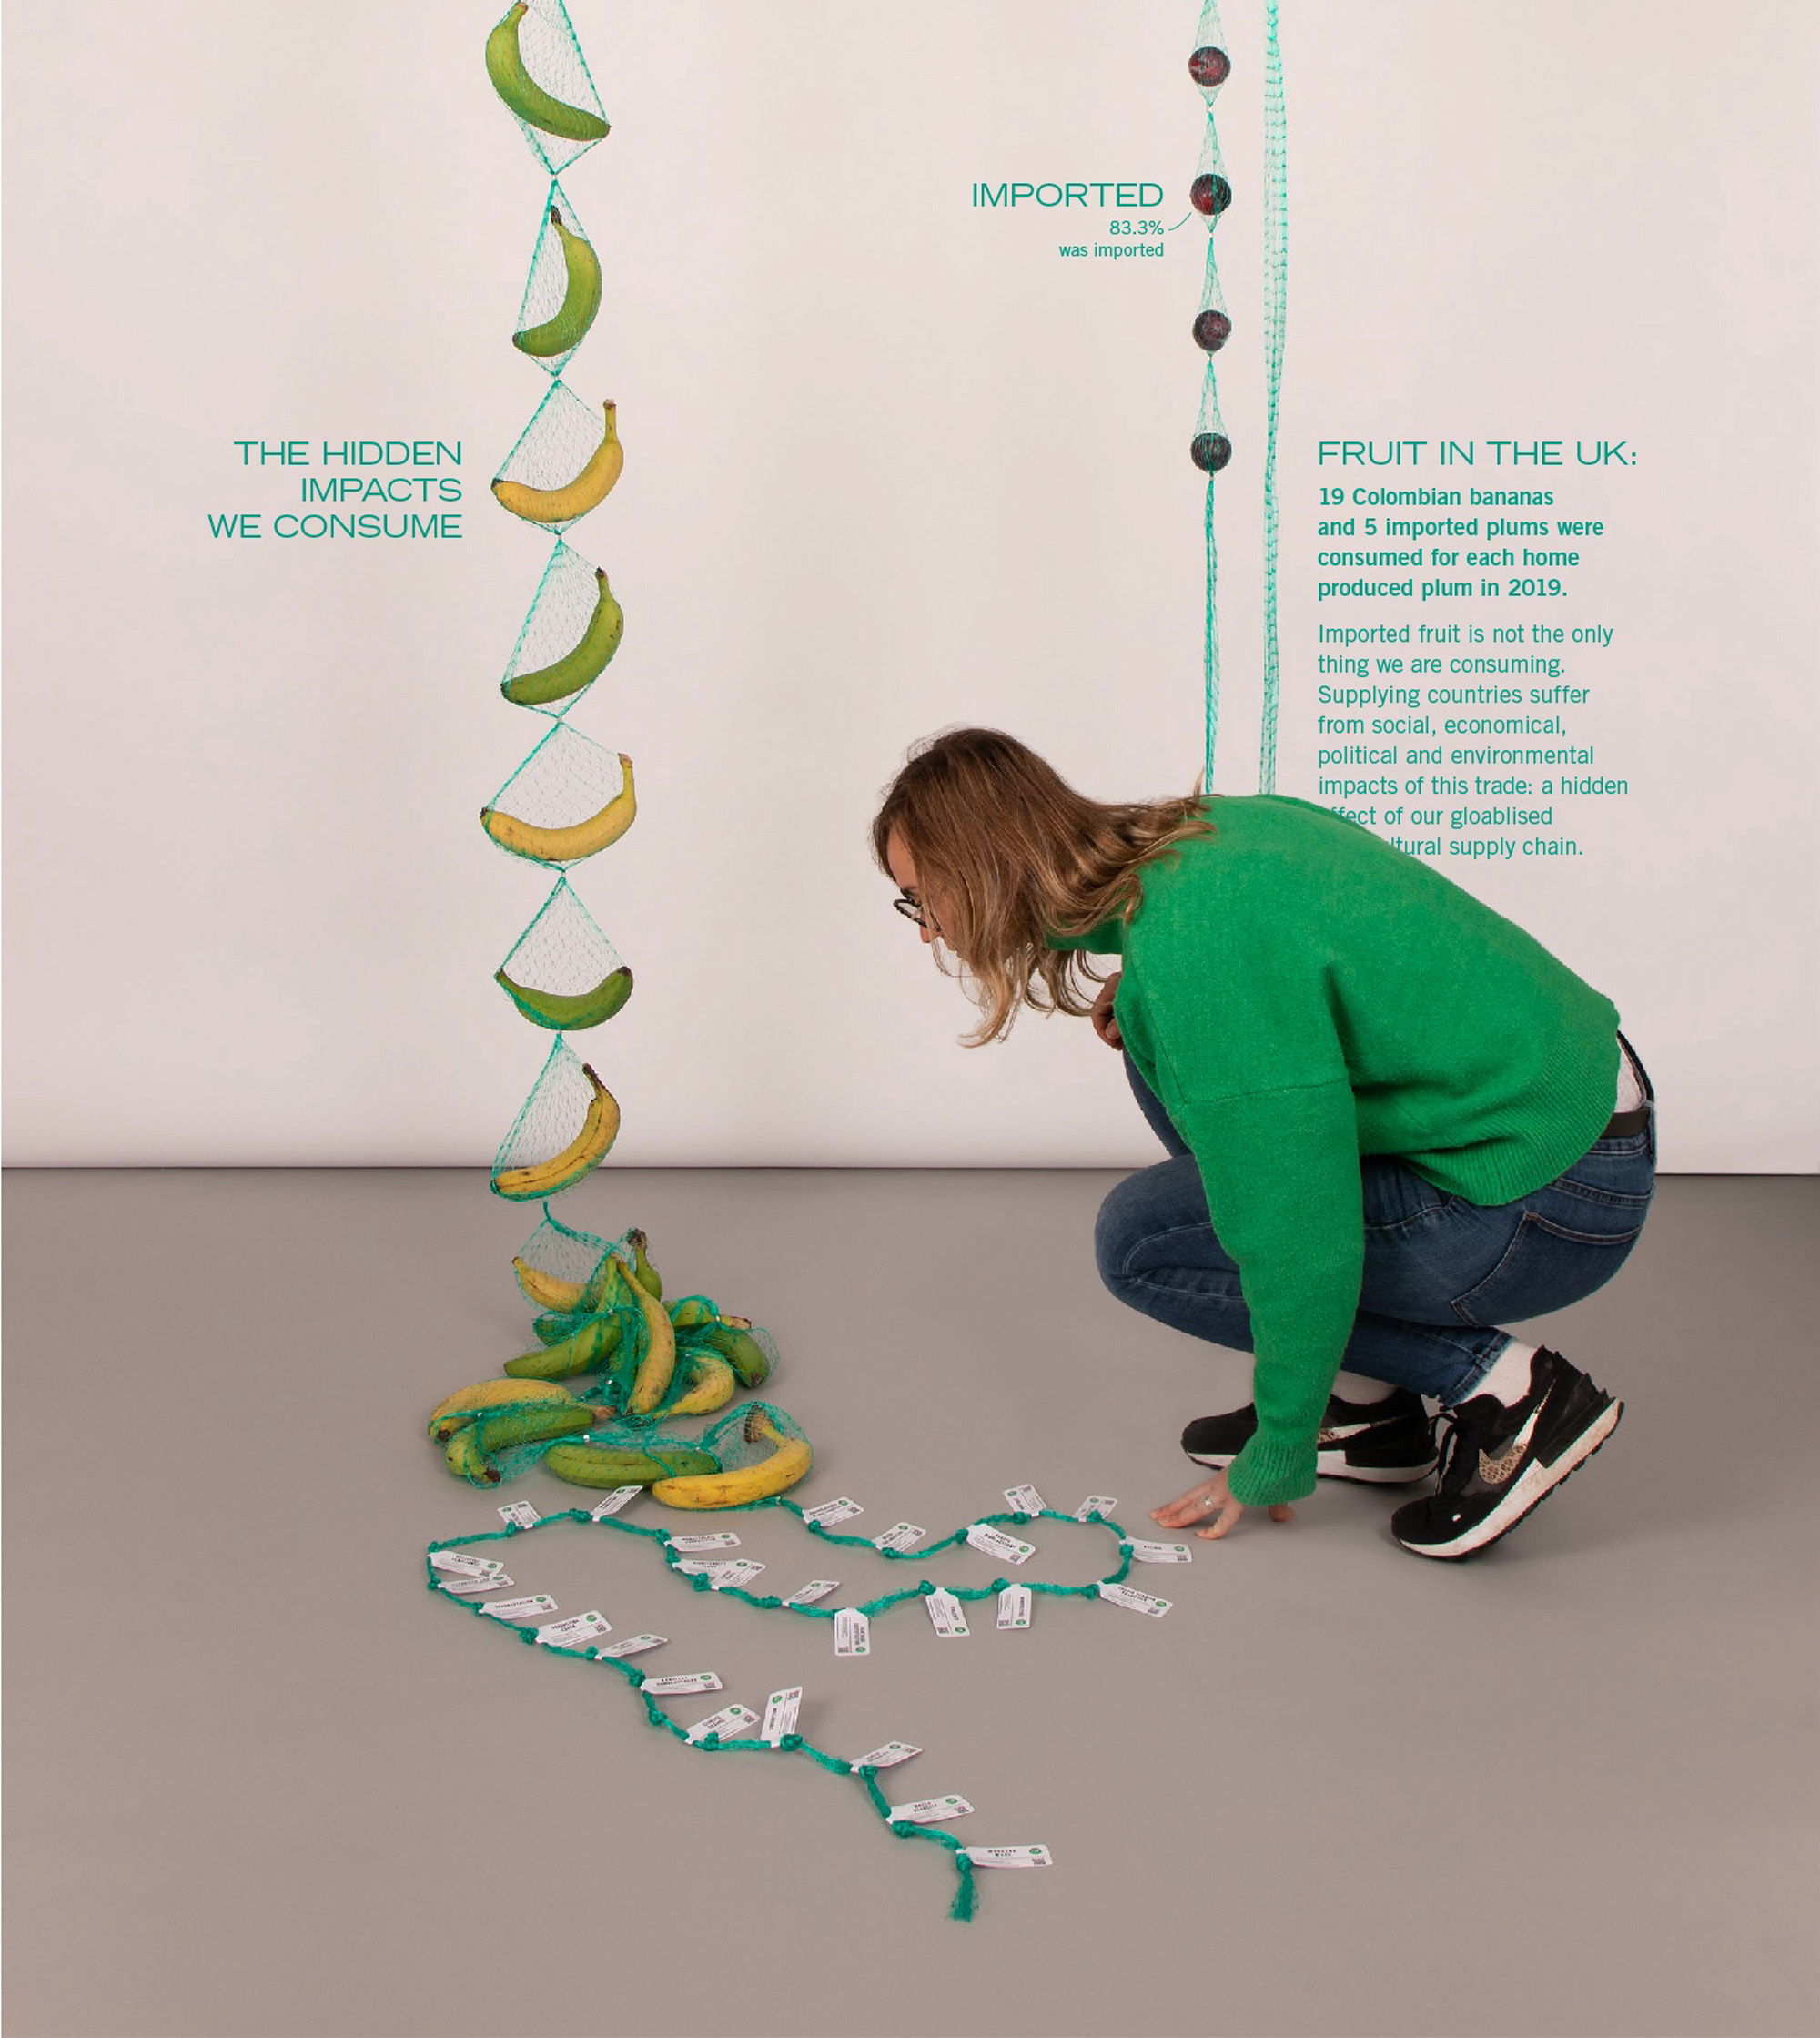
The hidden impacts we consume: imported and home-grown fruit in the UK.

Post_Networks
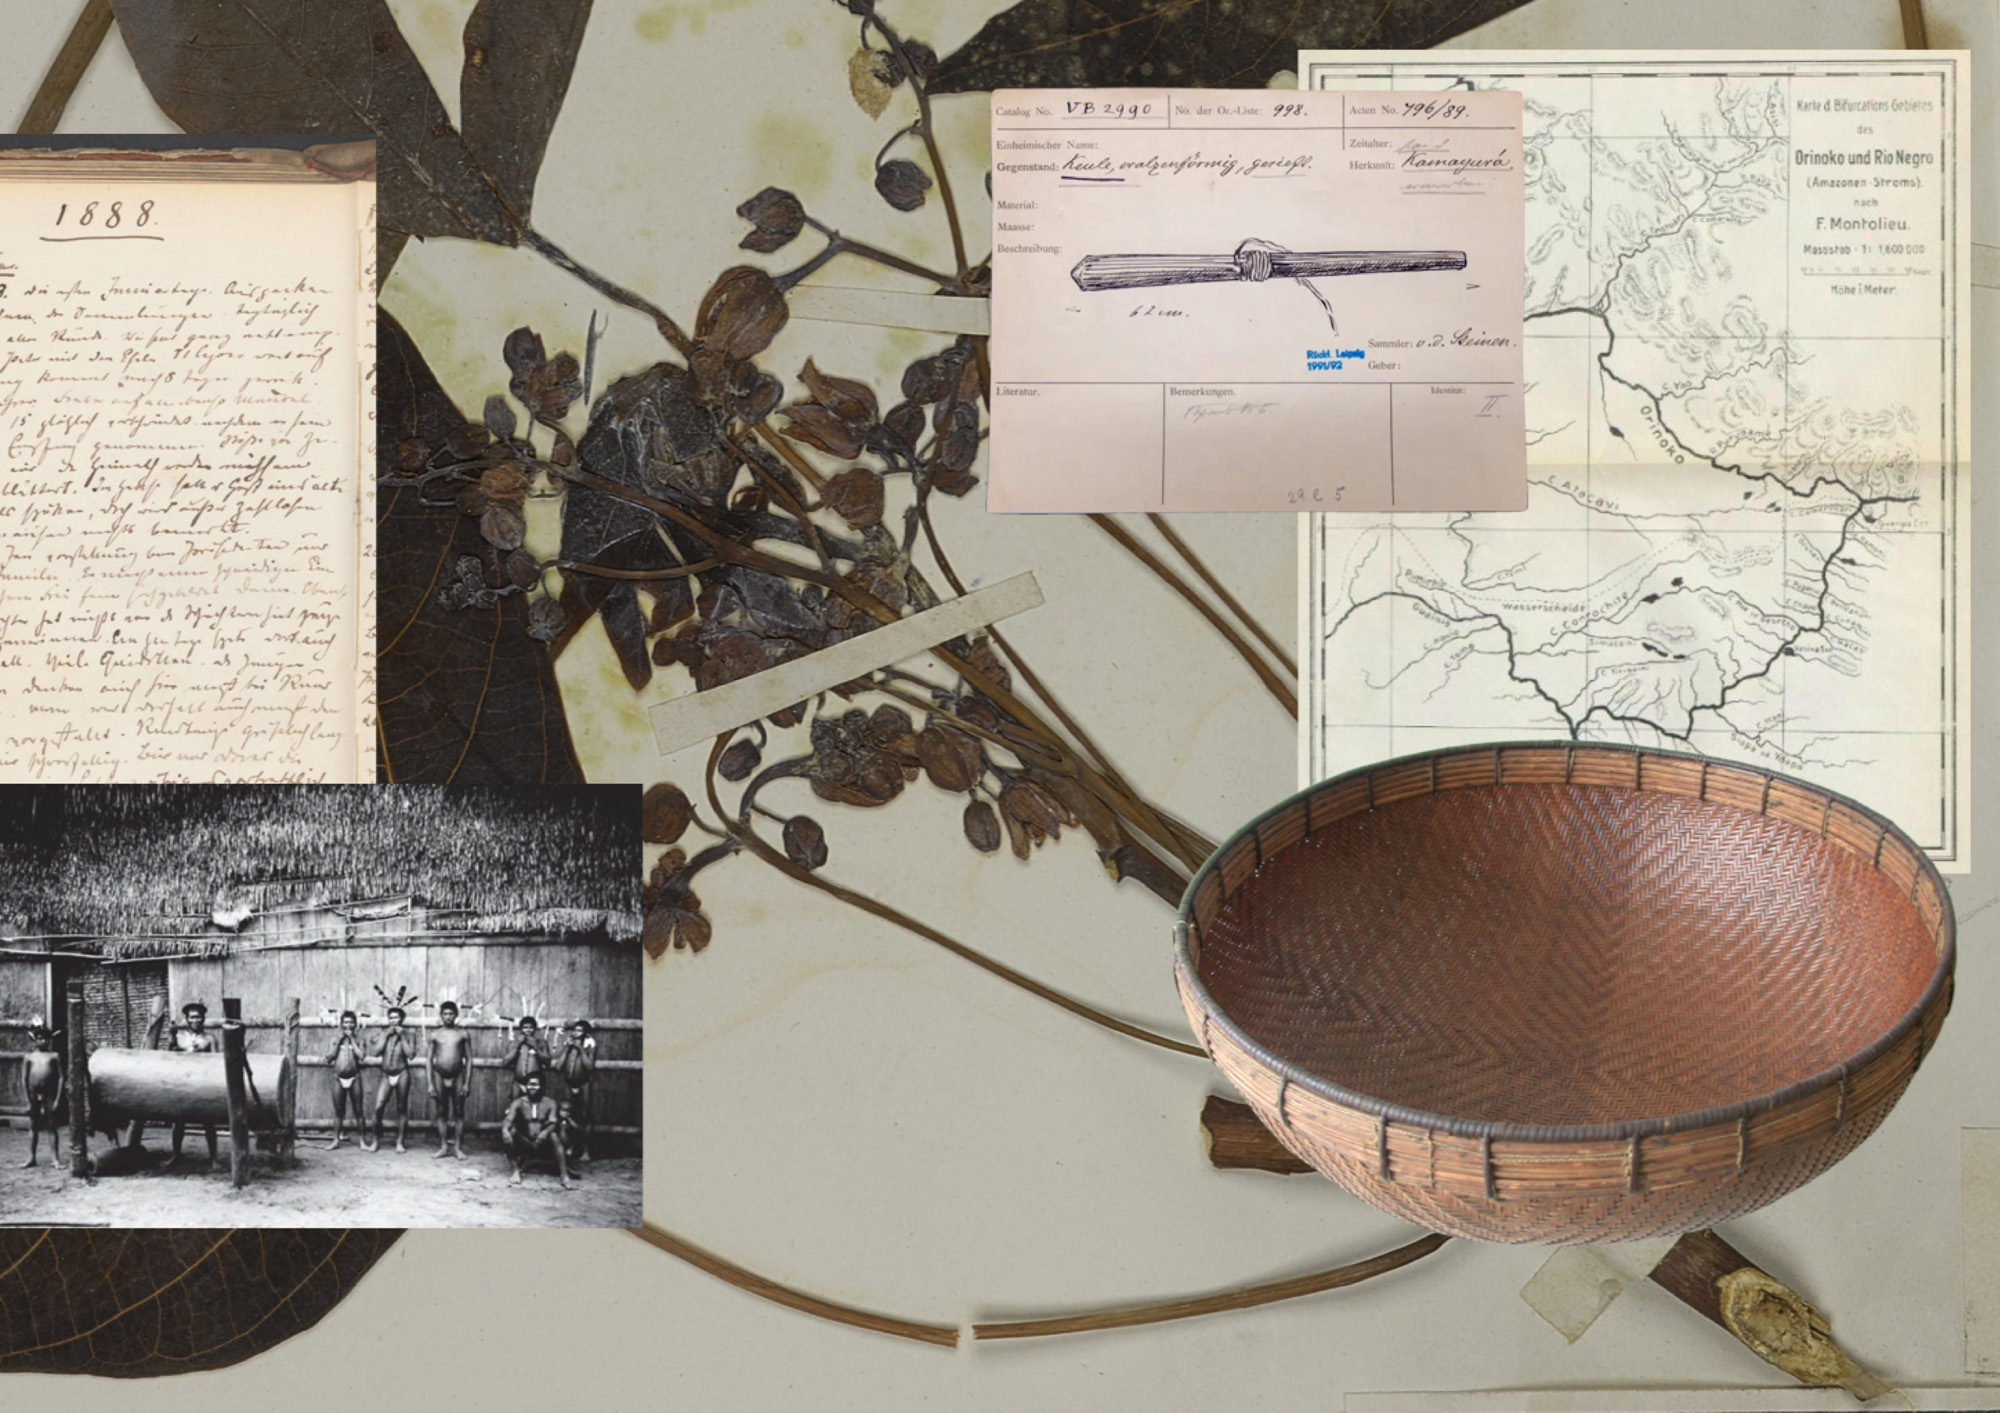
Xingú Entangled
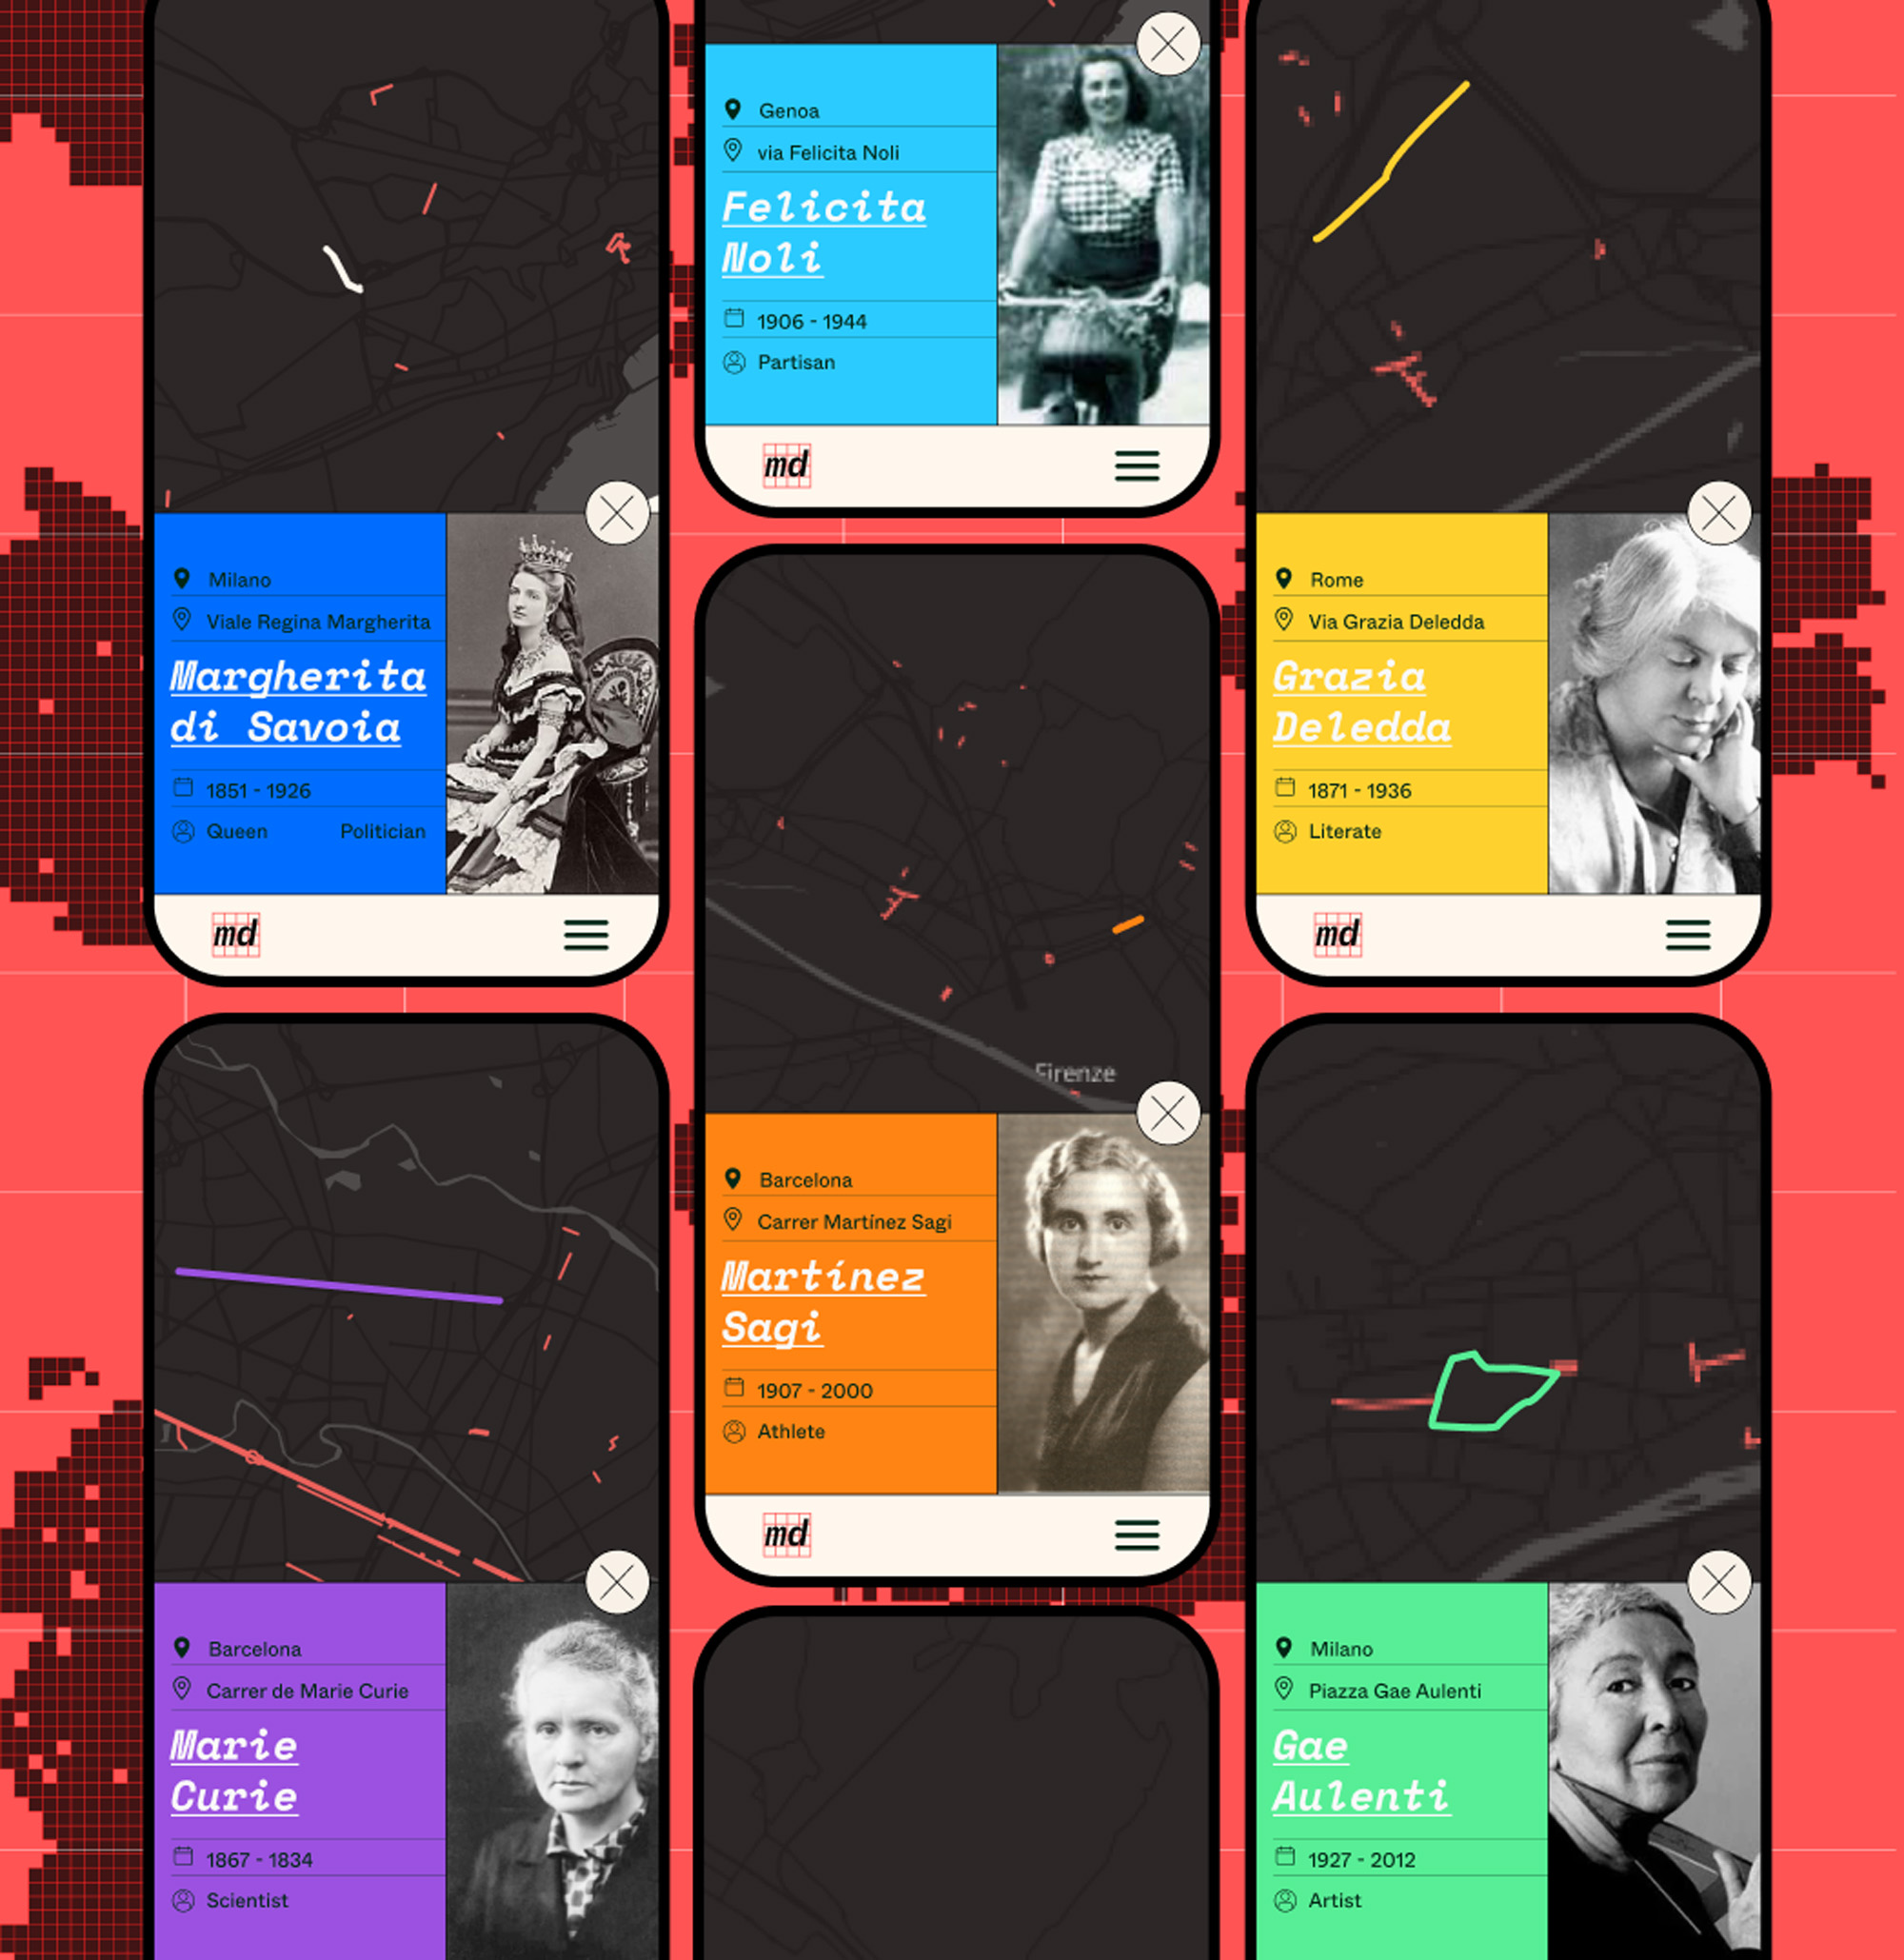
Mapping Diversity
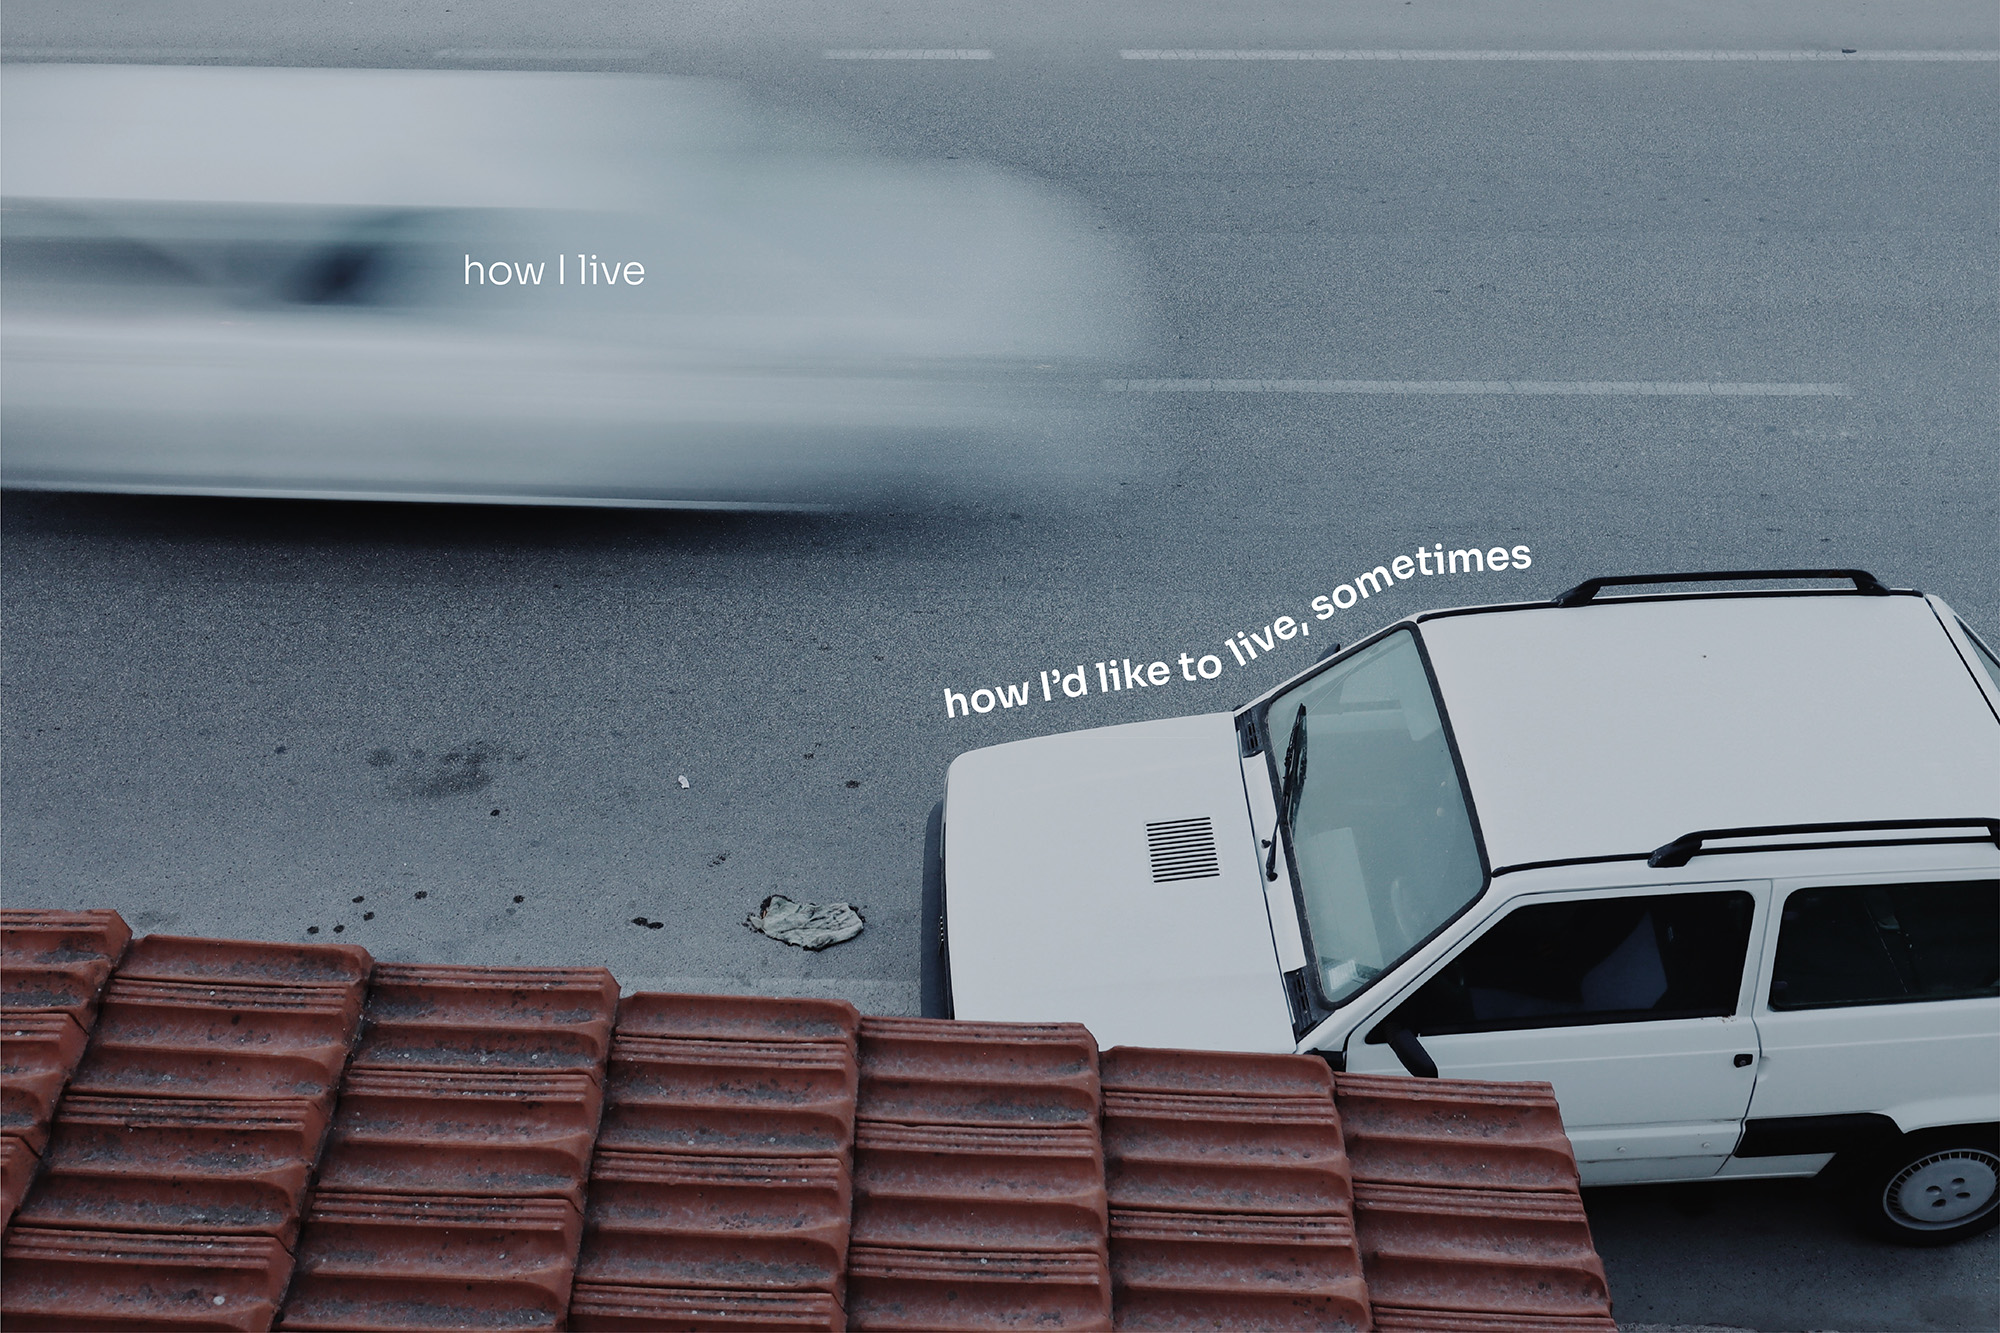
From my terrace
Back to Square one: when our fashion waste comes back to us
 - Junxiu Tang.jpg)
Posts with no Response: The Island of Loneliness
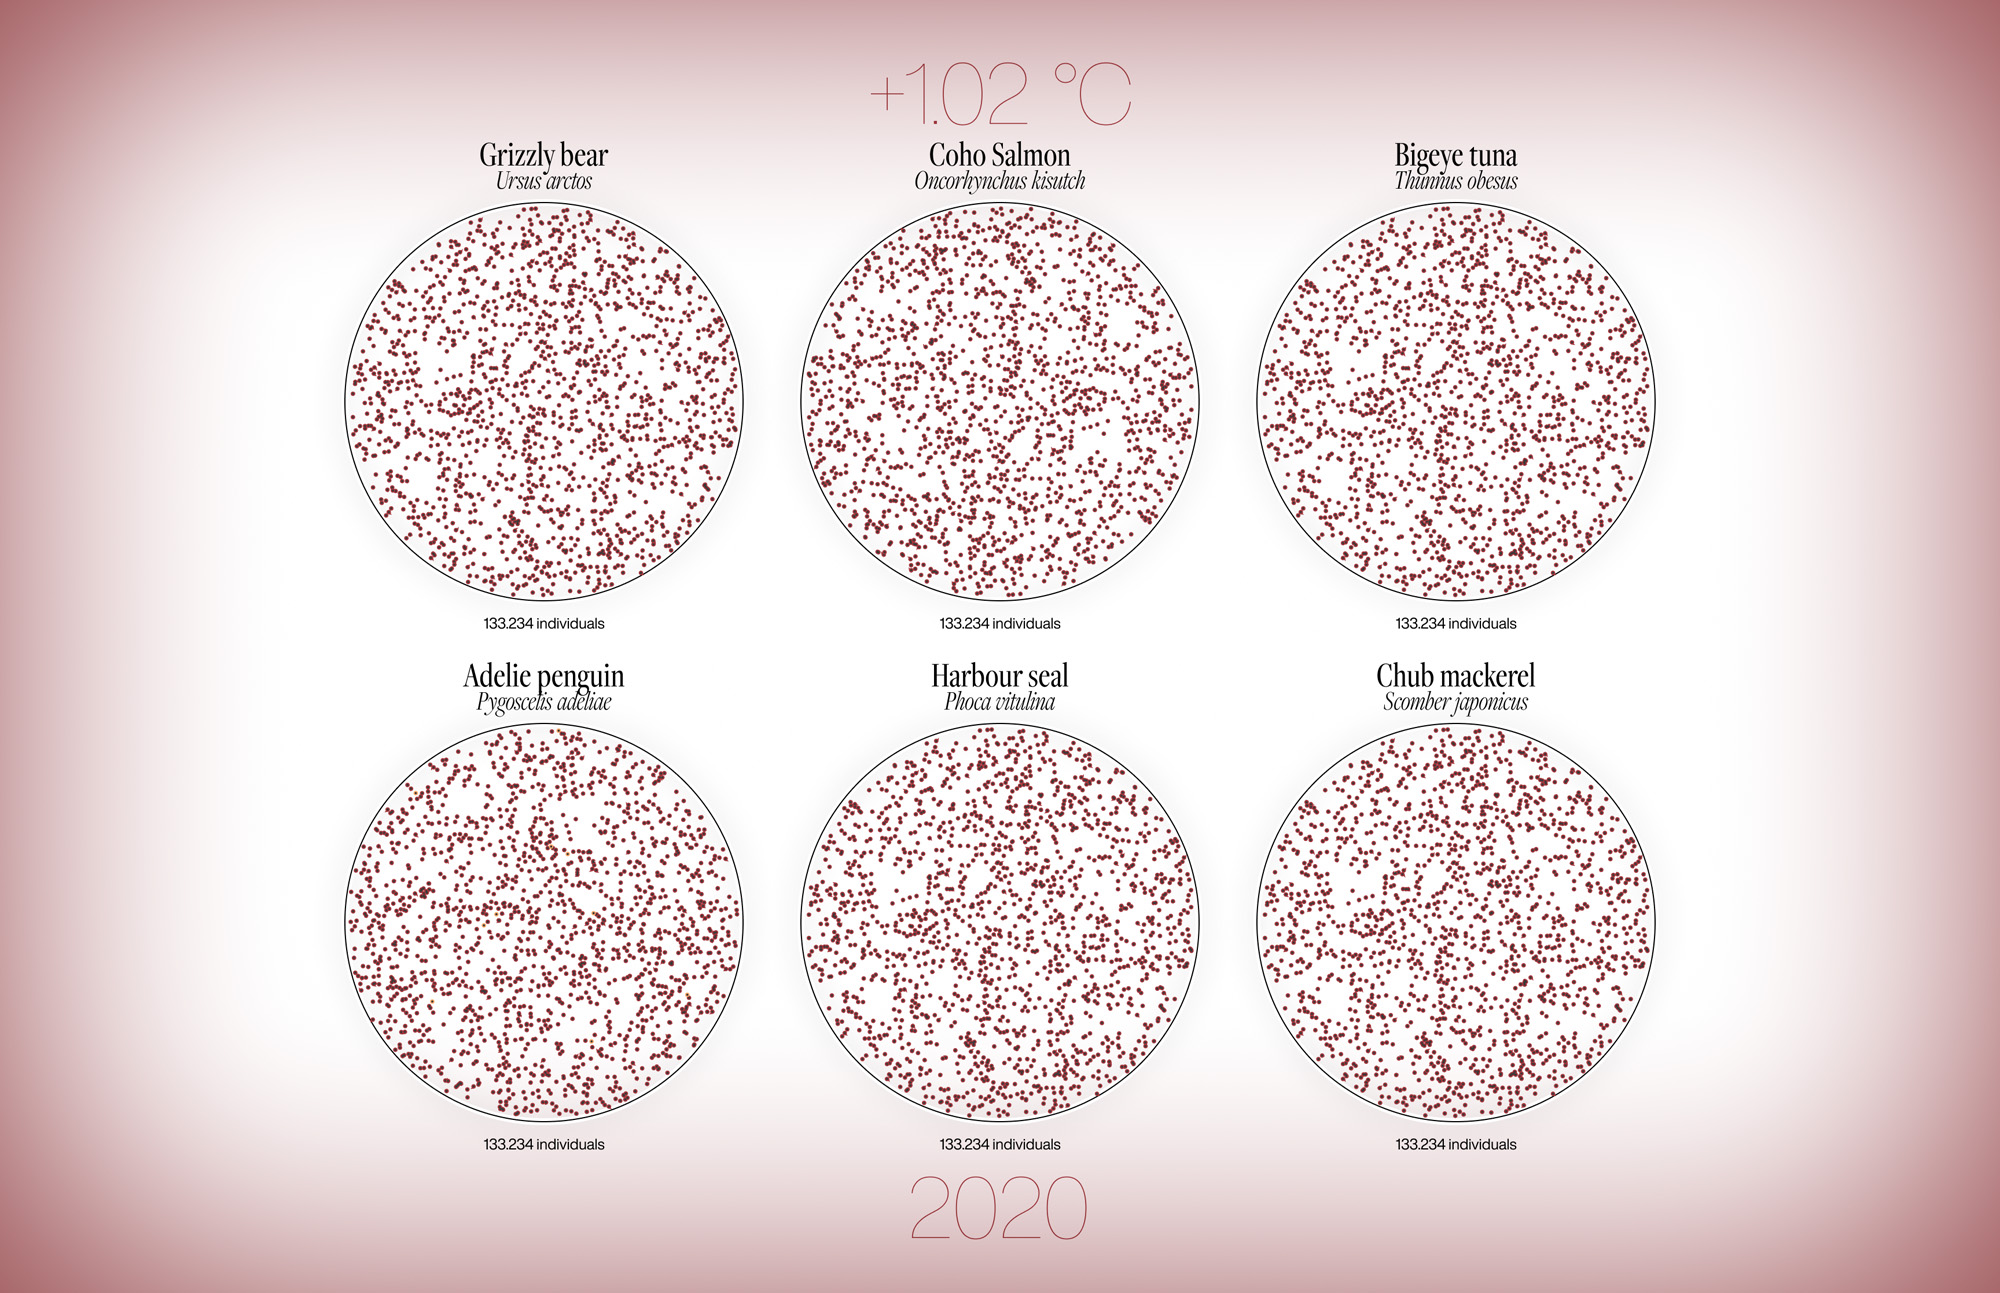
Macromicroscope: shifting scales in a heating world
Shine through Mars
Show (expired) call for Presentations
We are looking for a broad diversity of contributions, people, and topics, and we especially encourage practitioners, designers, artists, academics, and others who are not usually represented at visualization and other data-oriented venues. A limited example of practices and applications we are looking for are:
- Communication of science
- Data journalism and storytelling
- Design studies and visual explorations
- Digital humanities
- Automated (AI) visualizations
- Materiality of visualizations (i.e. physicalizations or performances)
- Graphic systems for data representation
- Metaphoric portrayals of data
- Data-embedded architecture, situated or environmental data
The work will be selected by the Exhibition chairs in consultation with the conference’s organizing committee. All accepted work will be featured on this website, and in an online and printed catalog. Authors of the pieces will be asked to give a short artist talk introducing their work at the opening of the exhibition. The authors will work with the conference organizers on details for showcasing their pieces in the exhibition. Exhibiting artists will get complimentary registrations to the Information+ conference. No artist fees are provided. If accepted, we can subsidize travel costs in certain cases: please reach out to the Exhibition chairs if you don’t have a supporting institution to subsidize your travel expenses.
To submit: Submissions are made via EasyChair
submission site.
The submission form in the system that will ask you to specify the nature of your
artwork/design piece and any technical and/space requirements.
Submission deadline: June 30, 2023, 23:59
AoE (Anywhere on Earth)

Venue & Location
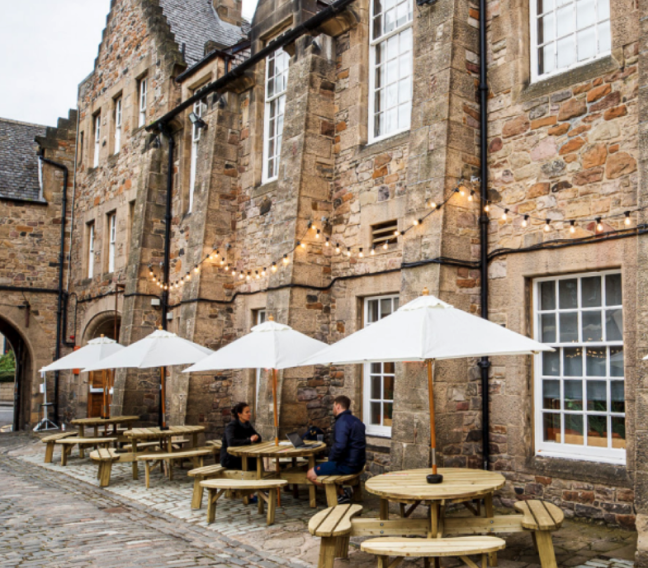
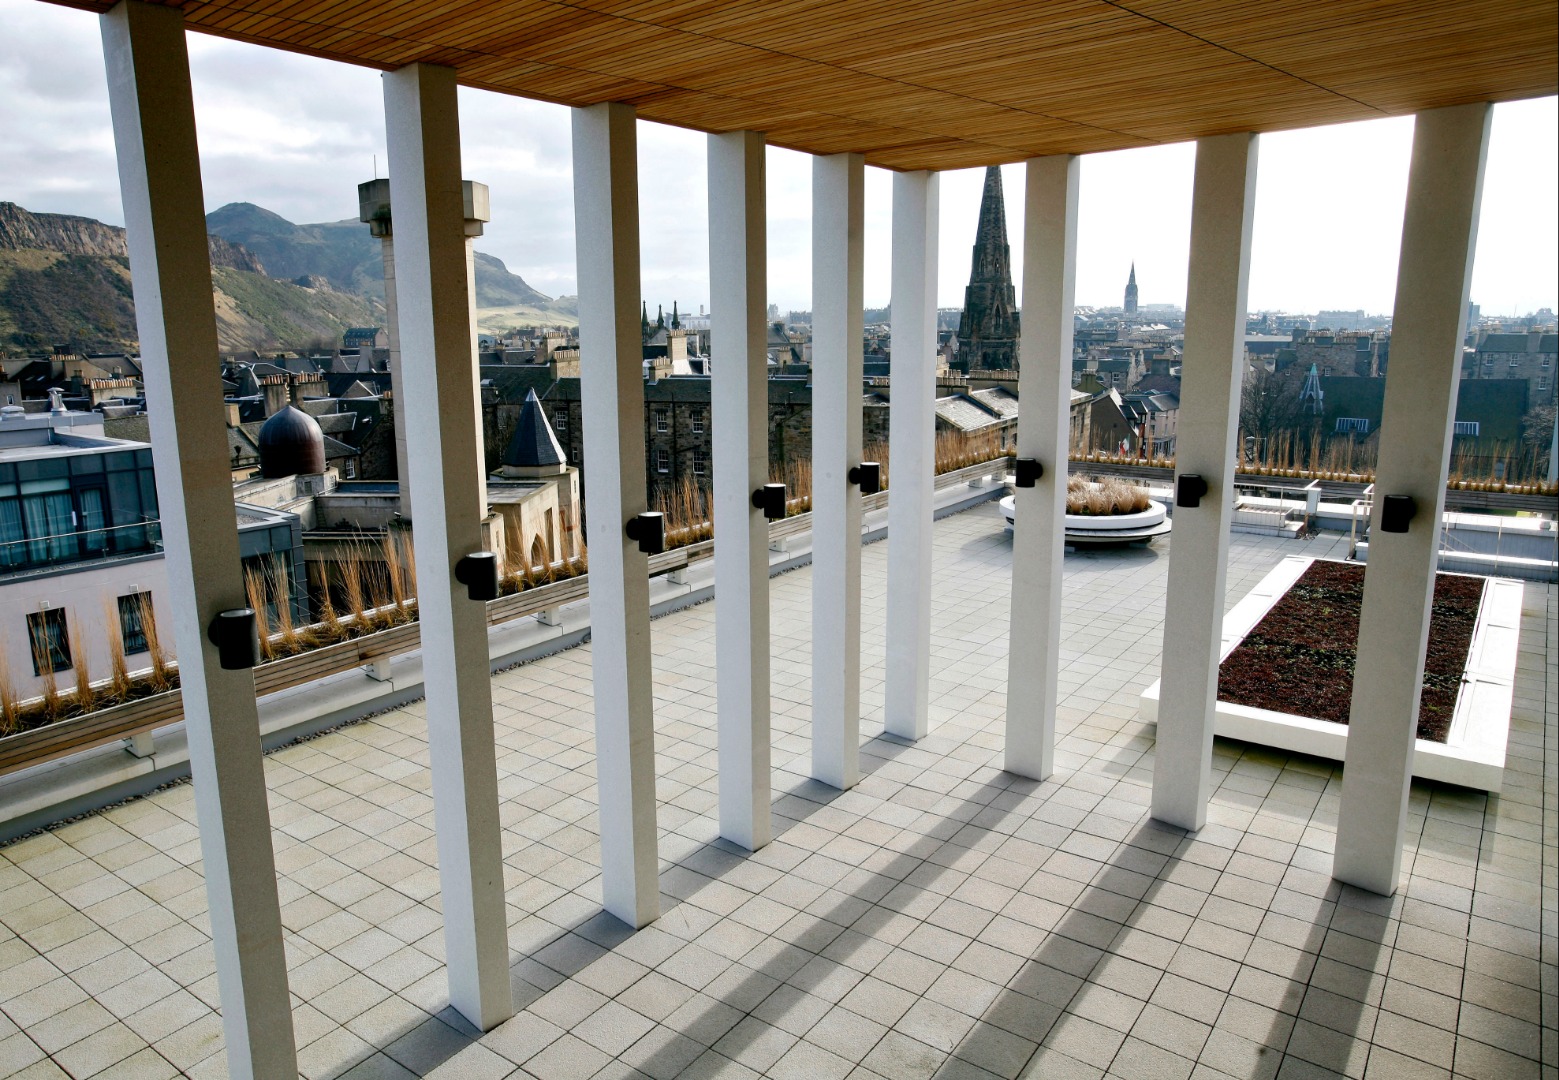
Information+ 2023 will take place in Edinburgh, Scotland. Edinburgh is the capital city of Scotland, and the seat of the Scottish Government, the Scottish Parliament and the highest courts in Scotland. It is also a city of UNESCO World Heritage, and invites for walks through the medieval streets of Old Town and the Georgian New Town, including the adjoining Dean Village and Calton Hill. Located at the southern shore of the Firth of Forth, the city is said to be built on seven hills, Blackford Hill, Arthur's Seat and the Castle Rock among them.
The city is and has long been a centre of education, particularly in medicine, Scottish law, literature, philosophy, the sciences, and engineering. In 2004 it was declared the first UNESCO City of Literature; for centuries Edinburgh has inspired writers from Sir Walter Scot, Robert Luis Stevensen, to Muriel Spark, Irvine Welsh and Ian Rankin, just to name a few.
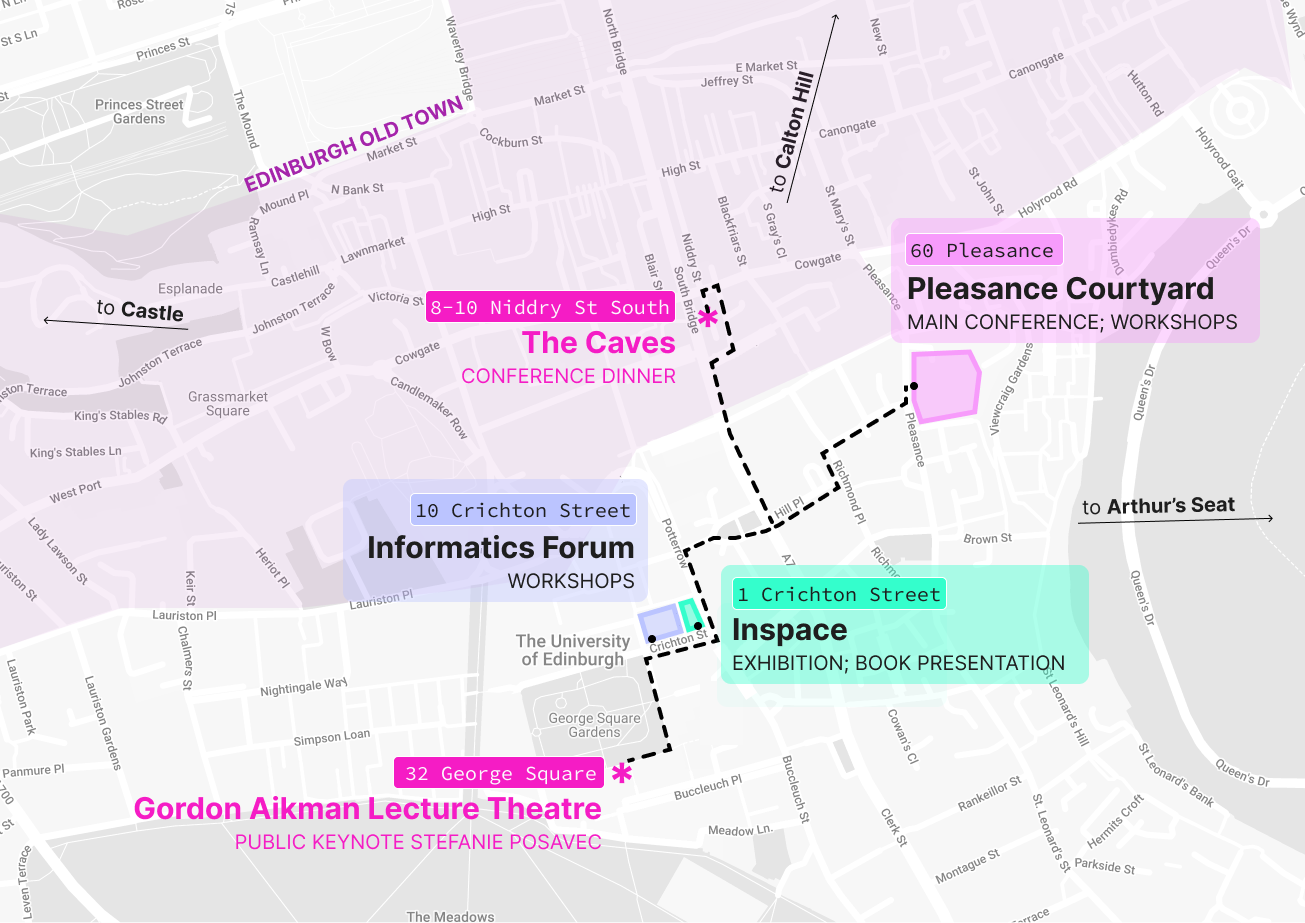
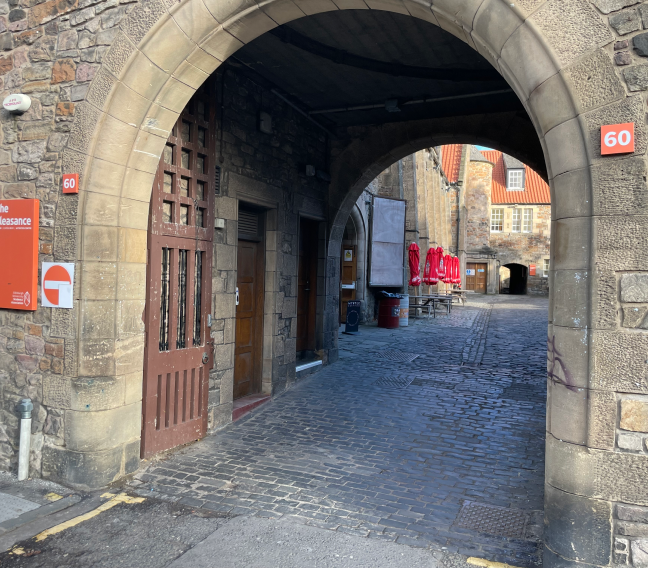
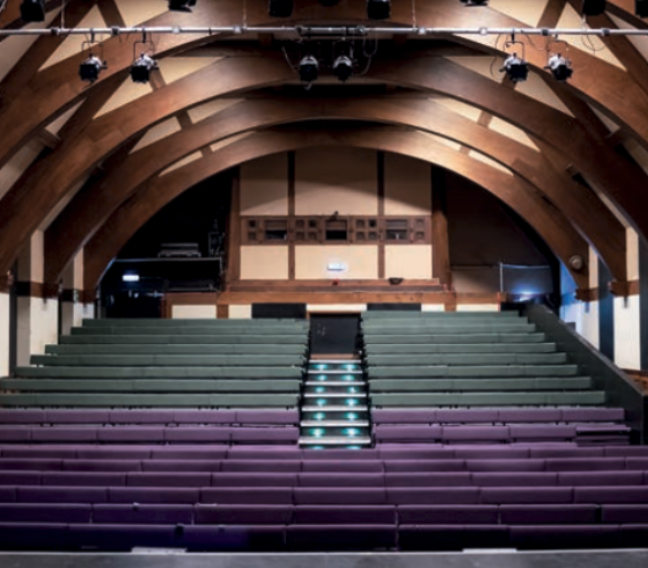
Main Conference: Pleasance Theatre
Information+ 2023 will be held at the Pleasance Theatre in Edinburgh, Scotland, which is located in walkable distance to Old Town.
Workshops: Informatics Forum
Workshops on November 22 will take place partly in rooms at the Pleasance Courtyard (see above), and at the Forum for Informatics (see below).

Address:
Informatics Forum
10 Crichton St,
Edinburgh EH8 9AB
The university is situated north of the city center. The campus and public transport to the location are wheelchair-accessible. For more information regarding accessibility please contact us via E-mail.
Travel
By plane
Edinburgh has an international airport located in the Ingliston area of
Edinburgh. If you arrive at Edinburgh airport, you can take the tram or the Bus 100
(Airlink) directly to the city centre. Of course, taxis are also
available.
Alternatively, you can fly into Glasgow. There are frequent trains going
from
Glasgow to Edinburgh.
By train
Edinburgh Waverley, Edinburgh’s main trains station is close to the city centre (Old Town), and well connected by public transport (bus or tram).
Public Transport
Edinburgh features a solid bus network (you can pay on the bus using your contactless card/device), and a tram that connects the airport to the city centre. Edinburgh is also a very walkable city, though hilly.
Where to stay
Edinburgh features a wide range of hotels across different price ranges. We recommend a hotel close to the city centre (Old Town). We list below some hotels that are in walking distance to the conference venues, but many others exist.
Hotel Du Vin Edinburgh
(12min walk)11 Bristo Place, Old Town, Edinburgh, EH1 1EZ
KM Hotel
(5min walk)7 Richmond Place, Edinburgh, EH8 9ST
ibis Edinburgh Centre South Bridge – Royal Mile
(10min walk)77 South Bridge, Old Town, Edinburgh, EH1 1HN
Apex Grassmarket Hotel
(15min walk)31-35 Grassmarket, Old Town, Edinburgh, EH1 2HS
Code of Conduct
All participants are required to agree with the following code of conduct. Organizers will enforce this code throughout the event. We expect cooperation from all participants to help ensure a safe environment for everybody.
Our conference is dedicated to providing a harassment-free conference experience for everyone, regardless of gender, gender identity and expression, age, sexual orientation, disability, physical appearance, body size, race, ethnicity, religion (or lack thereof), or technology choices. We do not tolerate harassment of conference participants in any form. Sexual language and imagery is not appropriate for any conference venue, including talks, workshops, breakout rooms, and other online media. Conference participants violating these rules may be sanctioned or expelled from the conference without a refund at the discretion of the conference organizers.
Harassment includes offensive verbal comments related to gender, gender identity and expression, age, sexual orientation, disability, physical appearance, body size, race, ethnicity, religion, technology choices, sexual images in public spaces, deliberate intimidation, stalking, following, harassing photography or recording, sustained disruption of talks or other events, and unwelcome sexual attention.
Participants asked to stop any harassing behavior are expected to comply immediately. If a participant engages in harassing behavior, the conference organizers may take any action they deem appropriate, including warning the offender or expulsion from the conference with no refund.
If you are being harassed, notice that someone else is being harassed, or have any other concerns, please contact a member of the organizing team immediately. You can also send an email to the organizers.
The conference organizers will be happy to help participants and assist those experiencing harassment to feel safe for the duration of the conference. We value your attendance.
We expect participants to follow these rules throughout the entire conference, all workshop activities, and conference-related social events.
About
Information+ 2023 is made possible through the help and support of many people and partnering organizations.
Conference Chairs
Uta Hinrichs, University of Edinburgh
Benjamin Bach, University of Edinburgh
Presentation Chairs
Miriah Meyer, Linköping University
Dietmar Offenhuber, Northeastern University
Workshops & Activity Chairs
Georgia Panagiotidou, King's College London
Samuel Huron, Telecom Paris Tech
Supporters Chairs
Daniel Archambault, Newcastle University
Cagatay Turkay, Warwick University
Diversity Scholarship Chairs
Catarina Maçãs, Universidade de Coimbra
Mushon Zer-Aviv, Independent
Exhibition Chairs
Pedro Cruz, Northeastern University
Carmen Hull, Northeastern University
Web, Design & Communication Chairs
Derya Akbaba, Linköping University
Tobias Kauer, University of Edinburgh
Zine Chair
Andrew McNutt, University of Chicago
Social Chairs
Areti Manataki, University of St. Andrews
Sarah Schöttler, University of Edinburgh
Student Volunteer Chairs
Xinhuan Shu, University of Edinburgh
Alexis Pister, University of Edinburgh
Advisors
Isabel Meirelles, OCAD
Marian Dörk, University of Applied Sciences Potsdam
Program Committee
Matthew Brehmer, Tableau
Pedro Cruz, Northeastern University
Rodrigo Medeiros, IFPB
Doris Kosminsky, UFRJ
Till Nagel, University of Applied Sciences Mannheim
Angus Forbes, University of California, Santa Cruz
Charles Perin, University of Victoria
Fearn Bishop, British Broadcasting Corporation
Laura Perovich, Northeastern University
Lisa-Charlotte Muth, Datawrapper
Alireza Karduni, IDEO
Maarten Lambrechts, Data journalist | Data designer | Visualization consultant
Veronika Egger, is-design
Brockett Horne, Northeastern University
Joel Ong, York University
Trevor Hogan, Munster Technological University
Mushon Zer-Aviv, Shenkar College
Dominikus Baur, Independent Researcher
Christopher Collins, Ontario Tech University
Alice Thudt, Interface Designer & Researcher
Katherine Gillieson, Emily Carr University of Art + Design
Lauren Klein, Emory University
Meghan Kelly, Durham University
Barbara Castro, State University of Rio de Janeiro
Maria De Los Ángeles Briones, Politecnico di Milano
Catarina Maçãs, University of Coimbra, CISUC, DEI
Wesley Willett, University of Calgary
Catherine D'Ignazio, MIT
Steven Boyd Davis, Royal College of Art
Rahul Bhargava, Northeastern University
Jonathan Schwabish, Urban Institute
Michele Mauri, Politecnico di Milano
Sarah Hayes, Munster Technological University
Tatiana Losev, Simon Fraser University
Clio Andris, Georgia Tech
Luiz Morais, Voxar Labs
Moritz Stefaner, Independent Designer & Consultant
Yuri Engelhardt, University of Twente
Kennedy Elliott, National Geographic
Nathalie Vladis, Brandeis University
Heather Corcoran, Washington University in St. Louis
Skye Moret, Pacific Northwest College of Art
Tiago Martins, University of Coimbra
Luiz Ludwig, PUC-Rio
Bon Adriel, Autodesk Research
Jan Willem Tulp, TULP interactive
Salomé Esteves, Universidade de Lisboa
Paolo Ciuccarelli, Northeastern University
Alexander Ivanov, University of Calgary
Isabel Meirelles, OCAD University
Beatrice Gobbo, Politecnico di Milano
Dario Rodighiero, University of Groningen
Angela Rout, TU Delft
Yoon Chung Han, San Jose State University
Matteo Moretti, University of Sassari & Sheldon.studio
Weidi Zhang, University of california, Santa Barbara
Social Media & Updates
For updates, find us on Twitter:
@InfoPlusConf
and Mastodon:
@InfoPlusConf@vis.social
For mentions, use the hashtag: #infoplus2023